Kielbasa vs. Lamb leg — In-Depth Nutrition Comparison
Compare
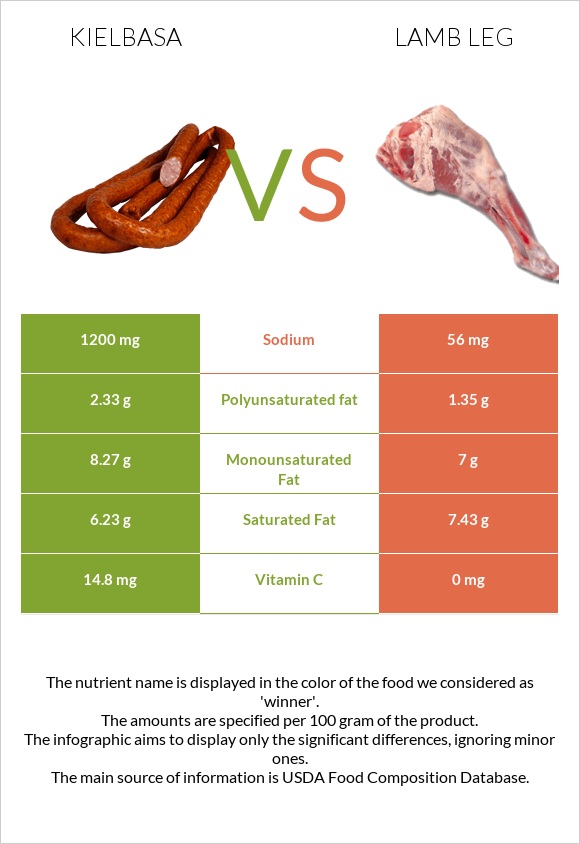
A recap on the differences between kielbasa and lamb leg
- Kielbasa has more vitamin C, monounsaturated fat, and polyunsaturated fat; however, lamb leg is higher in iron.
- Kielbasa covers your daily sodium needs 50% more than lamb leg.
- Lamb leg has less sodium.
- The glycemic index of kielbasa is higher.
Food varieties used in this article are Kielbasa, Polish, turkey, and beef, smoked and Lamb, domestic, leg, whole (shank and sirloin), separable lean, and fat, trimmed to 1/4" fat, choice, raw.
Infographic
Infographic link
Mineral Comparison
Mineral comparison score is based on the number of minerals by which one or the other food is richer. The "coverage" charts below show how much of the daily needs can be covered by 300 grams of the food.
| Contains more IronIron | +33.9% |
| Contains less SodiumSodium | -95.3% |
Vitamin Comparison
Vitamin comparison score is based on the number of vitamins by which one or the other food is richer. The "coverage" charts below show how much of the daily needs can be covered by 300 grams of the food.
| Contains more Vitamin CVitamin C | +∞% |
All nutrients comparison - raw data values
| Nutrient |  |
 |
DV% diff. |
| Vitamin B12 | 2.5µg | 104% | |
| Sodium | 1200mg | 56mg | 50% |
| Vitamin B3 | 6.26mg | 39% | |
| Selenium | 20.7µg | 38% | |
| Zinc | 3.32mg | 30% | |
| Phosphorus | 170mg | 24% | |
| Vitamin B2 | 0.23mg | 18% | |
| Vitamin C | 14.8mg | 0mg | 16% |
| Vitamin B5 | 0.69mg | 14% | |
| Copper | 0.113mg | 13% | |
| Vitamin B6 | 0.15mg | 12% | |
| Vitamin B1 | 0.13mg | 11% | |
| Protein | 13.1g | 17.91g | 10% |
| Potassium | 249mg | 7% | |
| Polyunsaturated fat | 2.33g | 1.35g | 7% |
| Magnesium | 23mg | 5% | |
| Iron | 1.24mg | 1.66mg | 5% |
| Folate | 19µg | 5% | |
| Saturated fat | 6.23g | 7.43g | 5% |
| Monounsaturated fat | 8.27g | 7g | 3% |
| Fats | 17.6g | 17.07g | 1% |
| Carbs | 3.9g | 0g | 1% |
| Calcium | 9mg | 1% | |
| Vitamin E | 0.21mg | 1% | |
| Manganese | 0.02mg | 1% | |
| Calories | 226kcal | 230kcal | 0% |
| Net carbs | 3.9g | 0g | N/A |
| Cholesterol | 70mg | 69mg | 0% |
| Tryptophan | 0.209mg | 0% | |
| Threonine | 0.767mg | 0% | |
| Isoleucine | 0.864mg | 0% | |
| Leucine | 1.393mg | 0% | |
| Lysine | 1.582mg | 0% | |
| Methionine | 0.46mg | 0% | |
| Phenylalanine | 0.729mg | 0% | |
| Valine | 0.967mg | 0% | |
| Histidine | 0.567mg | 0% |
Macronutrient Comparison
Macronutrient breakdown side-by-side comparison
| Contains more CarbsCarbs | +∞% |
| Contains more OtherOther | +385.7% |
| Contains more ProteinProtein | +36.7% |
~equal in
Fats
~17.07g
~equal in
Water
~64.32g
Fat Type Comparison
Fat type breakdown side-by-side comparison
| Contains less Sat. FatSaturated fat | -16.2% |
| Contains more Mono. FatMonounsaturated fat | +18.1% |
| Contains more Poly. FatPolyunsaturated fat | +72.6% |


