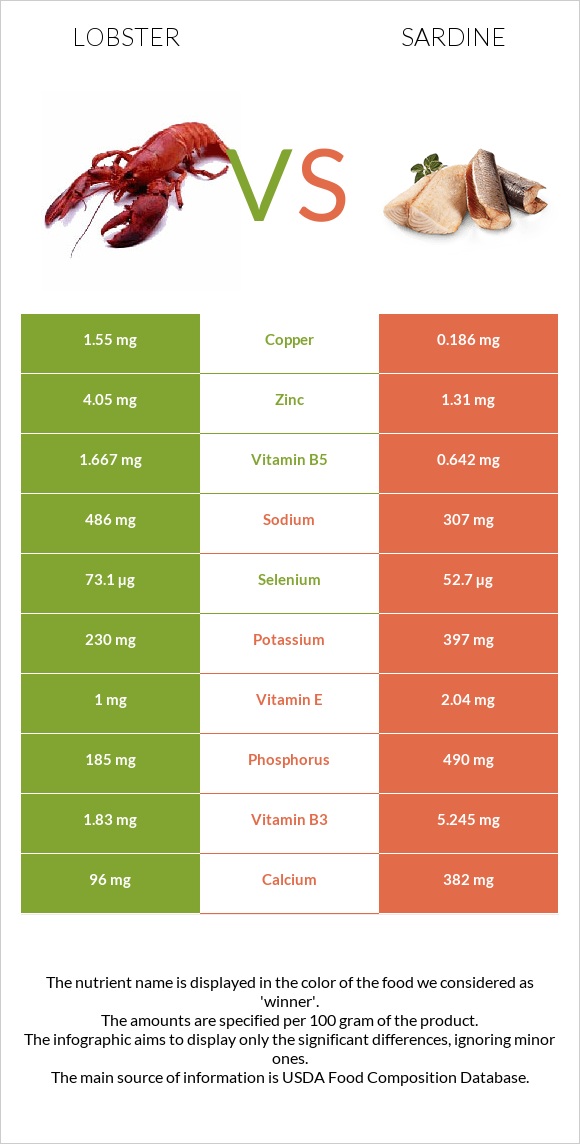
What are the main differences between lobster and sardines? Lobster is richer in copper, selenium, zinc, and vitamin B5, while sardines are higher in vitamin B12, phosphorus, iron, calcium, vitamin D* and vitamin B3. Sardines' daily need coverage for vitamin B12 is 313% higher. Sardines have 8 times less copper than lobster. Lobster has 1.55mg of copper, while sardines have 0.186mg. We used Crustaceans, lobster, northern, cooked, moist heat and Fish, sardine, Atlantic, canned in oil, drained solids with bone types in this comparison.
Infographic
Mineral Comparison
Mineral comparison score is based on the number of minerals by which one or the other food is richer. The "coverage" charts below show how much of the daily needs can be covered by 300 grams of the food.
3
100 g
300 g
3 oz - 85g 1 cup - 145g
Magnesium
Magnesium
Calcium
Calcium
Potassium
Potassium
Iron
Iron
Copper
Copper
Zinc
Zinc
Phosphorus
Phosphorus
Sodium
Sodium
Manganese
Manganese
Selenium
Selenium
31%
29%
20%
11%
517%
110%
79%
63%
8.5%
399%
6
100 g
300 g
1 small (2-2/3" x 1/2" x 1/4") - 12g 1 cubic inch - 16g 2 sardines - 24g 1 oz - 28.35g 1 can (3.75 oz) - 92g 1 cup, drained - 149g
Magnesium
Magnesium
Calcium
Calcium
Potassium
Potassium
Iron
Iron
Copper
Copper
Zinc
Zinc
Phosphorus
Phosphorus
Sodium
Sodium
Manganese
Manganese
Selenium
Selenium
28%
115%
35%
110%
62%
36%
210%
40%
14%
287%
Vitamin Comparison
Vitamin comparison score is based on the number of vitamins by which one or the other food is richer. The "coverage" charts below show how much of the daily needs can be covered by 300 grams of the food.
1
100 g
300 g
3 oz - 85g 1 cup - 145g
Vitamin C
Vit. C
Vitamin D
Vit. D
Vitamin A
Vit. A
Vitamin E
Vit. E
Vitamin B1
Vit. B1
Vitamin B2
Vit. B2
Vitamin B3
Vit. B3
Vitamin B5
Vit. B5
Vitamin B6
Vit. B6
Vitamin B12
Vit. B12
Vitamin K
Vit. K
Folate
Folate
0%
0%
0.33%
20%
5.8%
3.9%
34%
100%
27%
179%
0%
8.3%
9
100 g
300 g
1 small (2-2/3" x 1/2" x 1/4") - 12g 1 cubic inch - 16g 2 sardines - 24g 1 oz - 28.35g 1 can (3.75 oz) - 92g 1 cup, drained - 149g
Vitamin C
Vit. C
Vitamin D
Vit. D
Vitamin A
Vit. A
Vitamin E
Vit. E
Vitamin B1
Vit. B1
Vitamin B2
Vit. B2
Vitamin B3
Vit. B3
Vitamin B5
Vit. B5
Vitamin B6
Vit. B6
Vitamin B12
Vit. B12
Vitamin K
Vit. K
Folate
Folate
0%
72%
11%
41%
20%
52%
98%
39%
39%
1118%
6.5%
7.5%
All nutrients comparison - raw data values
Nutrient
DV% diff.
Vitamin B12
1.43µg
8.94µg
313%
Copper
1.55mg
0.186mg
152%
Phosphorus
185mg
490mg
44%
Selenium
73.1µg
52.7µg
37%
Iron
0.29mg
2.92mg
33%
Polyunsaturated fat
0.34g
5.148g
32%
Calcium
96mg
382mg
29%
Zinc
4.05mg
1.31mg
25%
Vitamin D*
1 IU
193 IU
24%
Vitamin D
0µg
4.8µg
24%
Vitamin B3
1.83mg
5.245mg
21%
Vitamin B5
1.667mg
0.642mg
21%
Fats
0.86g
11.45g
16%
Vitamin B2
0.017mg
0.227mg
16%
Protein
19g
24.62g
11%
Monounsaturated fat
0.253g
3.869g
9%
Sodium
486mg
307mg
8%
Vitamin E
1mg
2.04mg
7%
Calories
89kcal
208kcal
6%
Saturated fat
0.208g
1.528g
6%
Potassium
230mg
397mg
5%
Vitamin B1
0.023mg
0.08mg
5%
Vitamin B6
0.119mg
0.167mg
4%
Vitamin A
1µg
32µg
3%
Manganese
0.065mg
0.108mg
2%
Vitamin K
0µg
2.6µg
2%
Cholesterol
146mg
142mg
1%
Magnesium
43mg
39mg
1%
Choline
80.9mg
75mg
1%
Protein per 100 calories
21g
12g
N/A
Calories per 10 g protein
47kcal
84kcal
N/A
Weight per 100 calories
112g
48g
N/A
Unsaturated / Saturated Fat ratio
2.9
5.9
N/A
Folate
11µg
10µg
0%
Trans fat
0.013g
N/A
Tryptophan
0.248mg
0.276mg
0%
Threonine
0.753mg
1.079mg
0%
Isoleucine
0.832mg
1.134mg
0%
Leucine
1.376mg
2.001mg
0%
Lysine
1.426mg
2.26mg
0%
Methionine
0.475mg
0.729mg
0%
Phenylalanine
0.782mg
0.961mg
0%
Valine
0.852mg
1.268mg
0%
Histidine
0.475mg
0.725mg
0%
Omega-3 - EPA
0.117g
0.473g
N/A
Omega-3 - DHA
0.078g
0.509g
N/A
Omega-3 - ALA
0.05g
N/A
Omega-3 - DPA
0.006g
0g
N/A
Omega-3 - Eicosatrienoic acid
0.006g
N/A
Omega-6 - Dihomo-gamma-linoleic acid
0.006g
N/A
Omega-6 - Eicosadienoic acid
0.006g
N/A
Omega-6 - Linoleic acid
0.033g
N/A
Macronutrient Comparison
Macronutrient breakdown side-by-side comparison
1
19%
78%
2%
Protein:
19 g
Fats:
0.86 g
Carbs:
0 g
Water:
78.11 g
Other:
2.03 g
3
25%
11%
60%
4%
Protein:
24.62 g
Fats:
11.45 g
Carbs:
0 g
Water:
59.61 g
Other:
4.32 g
Contains
more
Water Water
+31%
Contains
more
Protein Protein
+29.6%
Contains
more
Fats Fats
+1231.4%
Contains
more
Other Other
+112.8%
Fat Type Comparison
Fat type breakdown side-by-side comparison
1
26%
32%
42%
Saturated fat:
Sat. Fat
0.208 g
Monounsaturated fat:
Mono. Fat
0.253 g
Polyunsaturated fat:
Poly. Fat
0.34 g
2
14%
37%
49%
Saturated fat:
Sat. Fat
1.528 g
Monounsaturated fat:
Mono. Fat
3.869 g
Polyunsaturated fat:
Poly. Fat
5.148 g
Contains
less
Sat. Fat Saturated fat
-86.4%
Contains
more
Mono. Fat Monounsaturated fat
+1429.2%
Contains
more
Poly. Fat Polyunsaturated fat
+1414.1%