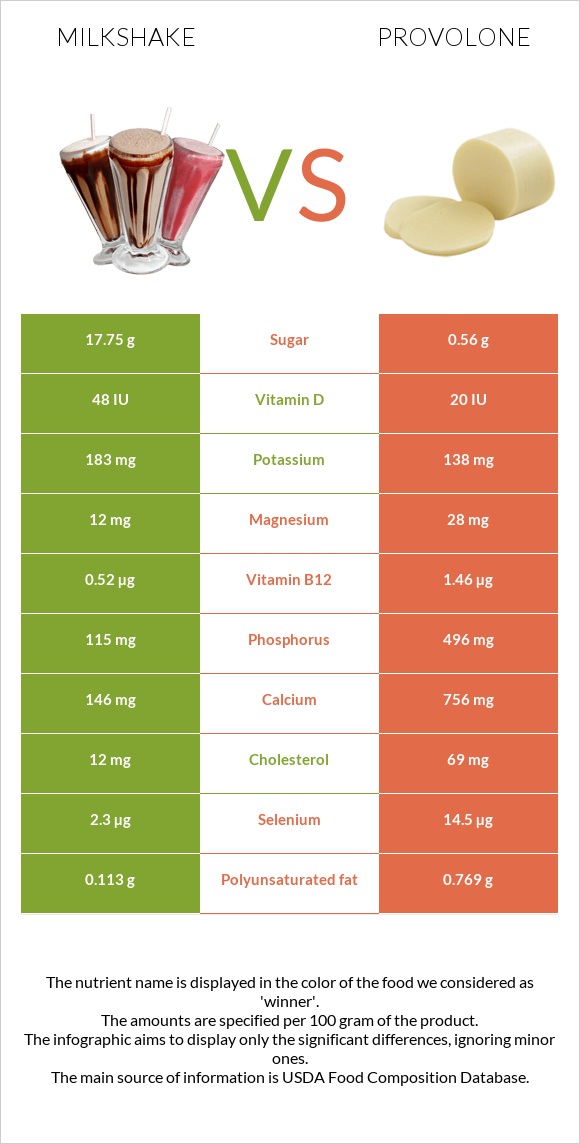
What are the main differences between milkshake and provolone? Milkshake has less calcium, phosphorus, vitamin B12, zinc, selenium, vitamin A, and vitamin B2 than provolone. Provolone's daily need coverage for saturated fat is 76% higher. Milkshake contains less cholesterol. We used Milk shakes, thick vanilla and Cheese, provolone types in this comparison.
Infographic
Mineral Comparison
Mineral comparison score is based on the number of minerals by which one or the other food is richer. The "coverage" charts below show how much of the daily needs can be covered by 300 grams of the food.
4
100 g
300 g
1 fl oz - 28.4g 1 container (11 oz) - 313g
Magnesium
Magnesium
Calcium
Calcium
Potassium
Potassium
Iron
Iron
Copper
Copper
Zinc
Zinc
Phosphorus
Phosphorus
Sodium
Sodium
Manganese
Manganese
Selenium
Selenium
8.6%
44%
16%
3.8%
17%
11%
49%
12%
1.8%
13%
6
100 g
300 g
1 cubic inch - 17g 1 slice (1 oz) - 28g 1 oz - 28.35g 1 cup, diced - 132g 1 package (6 oz) - 170g
Magnesium
Magnesium
Calcium
Calcium
Potassium
Potassium
Iron
Iron
Copper
Copper
Zinc
Zinc
Phosphorus
Phosphorus
Sodium
Sodium
Manganese
Manganese
Selenium
Selenium
20%
227%
12%
20%
8.7%
88%
213%
114%
1.3%
79%
Vitamin Comparison
Vitamin comparison score is based on the number of vitamins by which one or the other food is richer. The "coverage" charts below show how much of the daily needs can be covered by 300 grams of the food.
2
100 g
300 g
1 fl oz - 28.4g 1 container (11 oz) - 313g
Vitamin C
Vit. C
Vitamin D
Vit. D
Vitamin A
Vit. A
Vitamin E
Vit. E
Vitamin B1
Vit. B1
Vitamin B2
Vit. B2
Vitamin B3
Vit. B3
Vitamin B5
Vit. B5
Vitamin B6
Vit. B6
Vitamin B12
Vit. B12
Vitamin K
Vit. K
Folate
Folate
0%
18%
8.3%
1%
7.5%
45%
2.7%
22%
9.7%
65%
0.5%
5.3%
8
100 g
300 g
1 cubic inch - 17g 1 slice (1 oz) - 28g 1 oz - 28.35g 1 cup, diced - 132g 1 package (6 oz) - 170g
Vitamin C
Vit. C
Vitamin D
Vit. D
Vitamin A
Vit. A
Vitamin E
Vit. E
Vitamin B1
Vit. B1
Vitamin B2
Vit. B2
Vitamin B3
Vit. B3
Vitamin B5
Vit. B5
Vitamin B6
Vit. B6
Vitamin B12
Vit. B12
Vitamin K
Vit. K
Folate
Folate
0%
7.5%
79%
4.6%
4.8%
74%
2.9%
29%
17%
183%
5.5%
7.5%
All nutrients comparison - raw data values
Nutrient
DV% diff.
Saturated fat
1.886g
17.078g
69%
Calcium
146mg
756mg
61%
Phosphorus
115mg
496mg
54%
Protein
3.86g
25.58g
43%
Vitamin B12
0.52µg
1.46µg
39%
Fats
3.03g
26.62g
36%
Sodium
95mg
876mg
34%
Zinc
0.39mg
3.23mg
26%
Vitamin A
25µg
236µg
23%
Selenium
2.3µg
14.5µg
22%
Cholesterol
12mg
69mg
19%
Monounsaturated fat
0.875g
7.393g
16%
Calories
112kcal
351kcal
12%
Vitamin B2
0.195mg
0.321mg
10%
Carbs
17.75g
2.14g
5%
Iron
0.1mg
0.52mg
5%
Vitamin D*
48 IU
20 IU
4%
Vitamin D
1.2µg
0.5µg
4%
Magnesium
12mg
28mg
4%
Polyunsaturated fat
0.113g
0.769g
4%
Copper
0.051mg
0.026mg
3%
Vitamin B5
0.368mg
0.476mg
2%
Vitamin B6
0.042mg
0.073mg
2%
Vitamin K
0.2µg
2.2µg
2%
Potassium
183mg
138mg
1%
Vitamin E
0.05mg
0.23mg
1%
Vitamin B1
0.03mg
0.019mg
1%
Folate
7µg
10µg
1%
Protein per 100 calories
3.4g
7.3g
N/A
Calories per 10 g protein
290kcal
137kcal
N/A
Weight per 100 calories
89g
28g
N/A
Unsaturated / Saturated Fat ratio
0.52
0.48
N/A
Net carbs
17.75g
2.14g
N/A
Sugar
17.75g
0.56g
N/A
Manganese
0.014mg
0.01mg
0%
Vitamin B3
0.146mg
0.156mg
0%
Choline
14.3mg
15.4mg
0%
Tryptophan
0.054mg
0.345mg
0%
Threonine
0.174mg
0.982mg
0%
Isoleucine
0.234mg
1.091mg
0%
Leucine
0.378mg
2.297mg
0%
Lysine
0.306mg
2.646mg
0%
Methionine
0.097mg
0.686mg
0%
Phenylalanine
0.186mg
1.287mg
0%
Valine
0.258mg
1.64mg
0%
Histidine
0.105mg
1.115mg
0%
Macronutrient Comparison
Macronutrient breakdown side-by-side comparison
2
4%
3%
18%
74%
Protein:
3.86 g
Fats:
3.03 g
Carbs:
17.75 g
Water:
74.45 g
Other:
0.91 g
3
26%
27%
2%
41%
5%
Protein:
25.58 g
Fats:
26.62 g
Carbs:
2.14 g
Water:
40.95 g
Other:
4.71 g
Contains
more
Carbs Carbs
+729.4%
Contains
more
Water Water
+81.8%
Contains
more
Protein Protein
+562.7%
Contains
more
Fats Fats
+778.5%
Contains
more
Other Other
+417.6%
Fat Type Comparison
Fat type breakdown side-by-side comparison
1
66%
30%
4%
Saturated fat:
Sat. Fat
1.886 g
Monounsaturated fat:
Mono. Fat
0.875 g
Polyunsaturated fat:
Poly. Fat
0.113 g
2
68%
29%
3%
Saturated fat:
Sat. Fat
17.078 g
Monounsaturated fat:
Mono. Fat
7.393 g
Polyunsaturated fat:
Poly. Fat
0.769 g
Contains
less
Sat. Fat Saturated fat
-89%
Contains
more
Mono. Fat Monounsaturated fat
+744.9%
Contains
more
Poly. Fat Polyunsaturated fat
+580.5%