True morels vs. Chinese broccoli — In-Depth Nutrition Comparison
Compare
How are true morels and chinese broccoli different?
- True morels are higher in iron, copper, vitamin D, phosphorus, zinc, manganese, and vitamin B3; however, chinese broccoli is richer in vitamin A, folate, and calcium.
- Daily need coverage for iron for true morels is 145% higher.
Mushrooms, morel, raw and Broccoli, chinese, cooked are the varieties used in this article.
Infographic
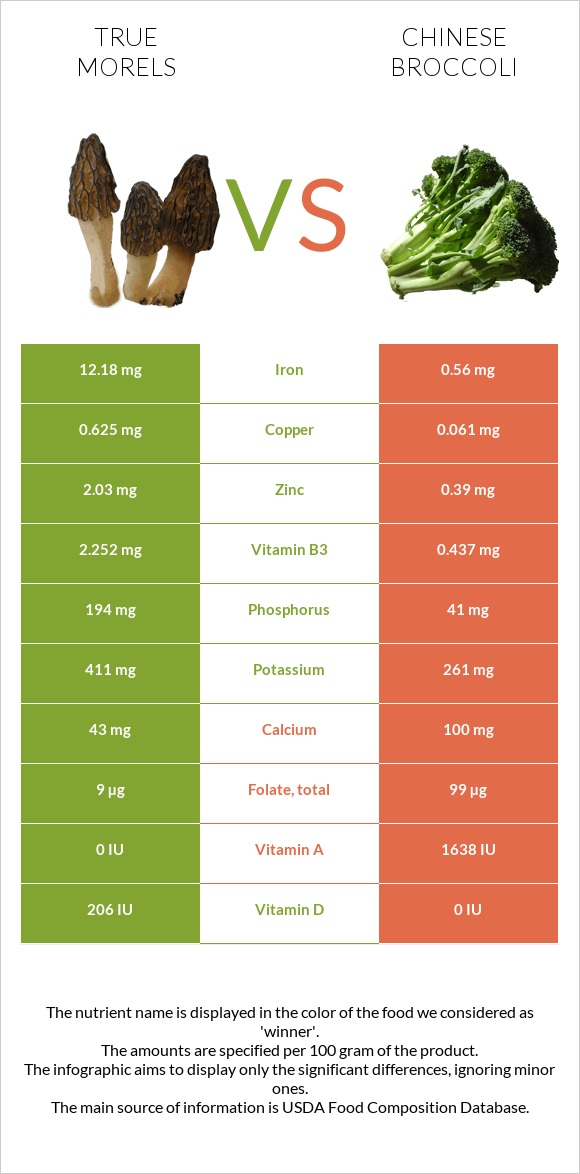
Infographic link
Mineral Comparison
Mineral comparison score is based on the number of minerals by which one or the other food is richer. The "coverage" charts below show how much of the daily needs can be covered by 300 grams of the food.
| Contains more PotassiumPotassium | +57.5% |
| Contains more IronIron | +2075% |
| Contains more CopperCopper | +924.6% |
| Contains more ZincZinc | +420.5% |
| Contains more PhosphorusPhosphorus | +373.2% |
| Contains more ManganeseManganese | +122.3% |
| Contains more SeleniumSelenium | +69.2% |
| Contains more CalciumCalcium | +132.6% |
| Contains less SodiumSodium | -66.7% |
Vitamin Comparison
Vitamin comparison score is based on the number of vitamins by which one or the other food is richer. The "coverage" charts below show how much of the daily needs can be covered by 300 grams of the food.
| Contains more Vitamin DVitamin D | +∞% |
| Contains more Vitamin B2Vitamin B2 | +40.4% |
| Contains more Vitamin B3Vitamin B3 | +415.3% |
| Contains more Vitamin B5Vitamin B5 | +176.7% |
| Contains more Vitamin B6Vitamin B6 | +94.3% |
| Contains more Vitamin AVitamin A | +∞% |
| Contains more Vitamin B1Vitamin B1 | +37.7% |
| Contains more FolateFolate | +1000% |
All nutrients comparison - raw data values
| Nutrient |  |
 |
DV% diff. |
| Iron | 12.18mg | 0.56mg | 145% |
| Vitamin K | 84.8µg | 71% | |
| Copper | 0.625mg | 0.061mg | 63% |
| Vitamin C | 28.2mg | 31% | |
| Vitamin D | 206 IU | 0 IU | 26% |
| Vitamin D | 5.1µg | 0µg | 26% |
| Folate | 9µg | 99µg | 23% |
| Phosphorus | 194mg | 41mg | 22% |
| Zinc | 2.03mg | 0.39mg | 15% |
| Manganese | 0.587mg | 0.264mg | 14% |
| Vitamin B3 | 2.252mg | 0.437mg | 11% |
| Vitamin A | 0µg | 82µg | 9% |
| Calcium | 43mg | 100mg | 6% |
| Vitamin B5 | 0.44mg | 0.159mg | 6% |
| Vitamin B2 | 0.205mg | 0.146mg | 5% |
| Vitamin B6 | 0.136mg | 0.07mg | 5% |
| Choline | 25.3mg | 5% | |
| Protein | 3.12g | 1.14g | 4% |
| Potassium | 411mg | 261mg | 4% |
| Vitamin E | 0.48mg | 3% | |
| Selenium | 2.2µg | 1.3µg | 2% |
| Vitamin B1 | 0.069mg | 0.095mg | 2% |
| Fiber | 2.8g | 2.5g | 1% |
| Sodium | 21mg | 7mg | 1% |
| Polyunsaturated fat | 0.433g | 0.33g | 1% |
| Calories | 31kcal | 22kcal | 0% |
| Fats | 0.57g | 0.72g | 0% |
| Net carbs | 2.3g | 1.31g | N/A |
| Carbs | 5.1g | 3.81g | 0% |
| Magnesium | 19mg | 18mg | 0% |
| Sugar | 0.6g | 0.84g | N/A |
| Saturated fat | 0.065g | 0.11g | 0% |
| Monounsaturated fat | 0.052g | 0.05g | 0% |
| Omega-6 - Eicosadienoic acid | 0.001g | N/A | |
| Omega-6 - Linoleic acid | 0.215g | N/A |
Macronutrient Comparison
Macronutrient breakdown side-by-side comparison
Protein:
3.12 g
Fats:
0.57 g
Carbs:
5.1 g
Water:
89.61 g
Other:
1.6 g
Protein:
1.14 g
Fats:
0.72 g
Carbs:
3.81 g
Water:
93.54 g
Other:
0.79 g
| Contains more ProteinProtein | +173.7% |
| Contains more CarbsCarbs | +33.9% |
| Contains more OtherOther | +102.5% |
| Contains more FatsFats | +26.3% |
~equal in
Water
~93.54g
Fat Type Comparison
Fat type breakdown side-by-side comparison
Saturated fat:
Sat. Fat
0.065 g
Monounsaturated fat:
Mono. Fat
0.052 g
Polyunsaturated fat:
Poly. Fat
0.433 g
Saturated fat:
Sat. Fat
0.11 g
Monounsaturated fat:
Mono. Fat
0.05 g
Polyunsaturated fat:
Poly. Fat
0.33 g
| Contains less Sat. FatSaturated fat | -40.9% |
| Contains more Poly. FatPolyunsaturated fat | +31.2% |
~equal in
Monounsaturated fat
~0.05g


