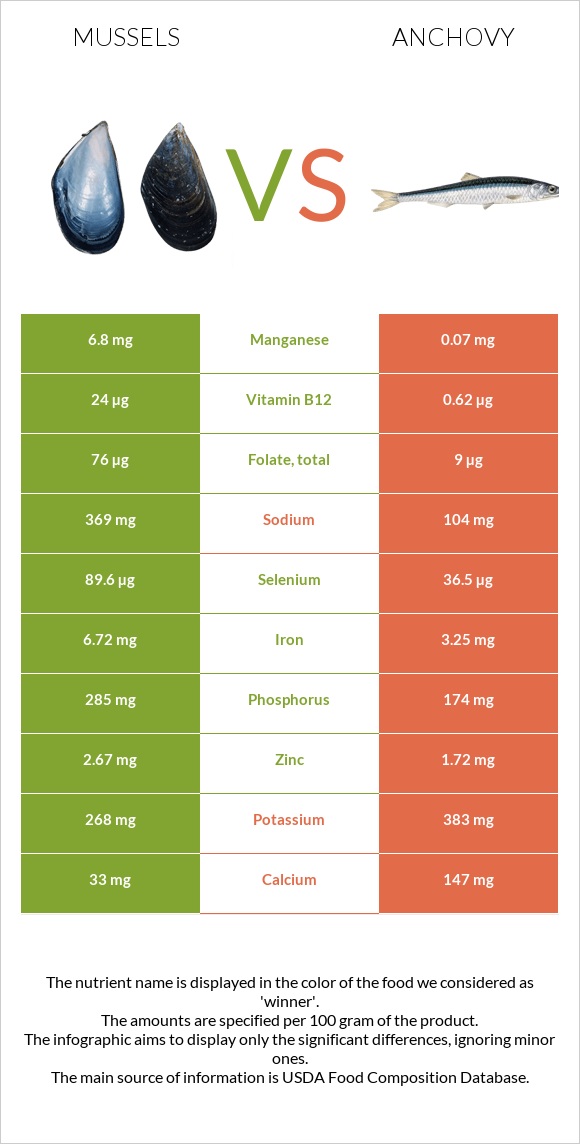
What are the main differences between mussels and anchovies? Mussels is richer in vitamin B12, manganese, selenium, iron, vitamin B1, folate, phosphorus, vitamin C, and vitamin B2, yet anchovies are richer in vitamin B3. Mussels's daily need coverage for vitamin B12 is 974% higher. Anchovies have a lower glycemic index than mussels. We used Mollusks, mussel, blue, cooked, moist heat and Fish, anchovy, european, raw types in this comparison.
Infographic
Mineral Comparison
Mineral comparison score is based on the number of minerals by which one or the other food is richer. The "coverage" charts below show how much of the daily needs can be covered by 300 grams of the food.
5
100 g
300 g
3 oz - 85g
Magnesium
Magnesium
Calcium
Calcium
Potassium
Potassium
Iron
Iron
Copper
Copper
Zinc
Zinc
Phosphorus
Phosphorus
Sodium
Sodium
Manganese
Manganese
Selenium
Selenium
26%
9.9%
24%
252%
50%
73%
122%
48%
887%
489%
5
100 g
300 g
3 oz - 85g
Magnesium
Magnesium
Calcium
Calcium
Potassium
Potassium
Iron
Iron
Copper
Copper
Zinc
Zinc
Phosphorus
Phosphorus
Sodium
Sodium
Manganese
Manganese
Selenium
Selenium
29%
44%
34%
122%
70%
47%
75%
14%
9.1%
199%
Vitamin Comparison
Vitamin comparison score is based on the number of vitamins by which one or the other food is richer. The "coverage" charts below show how much of the daily needs can be covered by 300 grams of the food.
7
100 g
300 g
3 oz - 85g
Vitamin C
Vit. C
Vitamin D
Vit. D
Vitamin A
Vit. A
Vitamin E
Vit. E
Vitamin B1
Vit. B1
Vitamin B2
Vit. B2
Vitamin B3
Vit. B3
Vitamin B5
Vit. B5
Vitamin B6
Vit. B6
Vitamin B12
Vit. B12
Vitamin K
Vit. K
Folate
Folate
45%
0%
30%
0%
75%
97%
56%
57%
23%
3000%
0%
57%
4
100 g
300 g
3 oz - 85g
Vitamin C
Vit. C
Vitamin D
Vit. D
Vitamin A
Vit. A
Vitamin E
Vit. E
Vitamin B1
Vit. B1
Vitamin B2
Vit. B2
Vitamin B3
Vit. B3
Vitamin B5
Vit. B5
Vitamin B6
Vit. B6
Vitamin B12
Vit. B12
Vitamin K
Vit. K
Folate
Folate
0%
0%
5%
11%
14%
59%
263%
39%
33%
78%
0.25%
6.8%
All nutrients comparison - raw data values
Nutrient
DV% diff.
Vitamin B12
24µg
0.62µg
974%
Manganese
6.8mg
0.07mg
293%
Selenium
89.6µg
36.5µg
97%
Vitamin B3
3mg
14.024mg
69%
Iron
6.72mg
3.25mg
43%
Vitamin B1
0.3mg
0.055mg
20%
Folate
76µg
9µg
17%
Phosphorus
285mg
174mg
16%
Vitamin C
13.6mg
0mg
15%
Vitamin B2
0.42mg
0.256mg
13%
Sodium
369mg
104mg
12%
Calcium
33mg
147mg
11%
Zinc
2.67mg
1.72mg
9%
Vitamin A
91µg
15µg
8%
Protein
23.8g
20.35g
7%
Copper
0.149mg
0.211mg
7%
Vitamin B5
0.95mg
0.645mg
6%
Vitamin E
0.57mg
4%
Potassium
268mg
383mg
3%
Vitamin B6
0.1mg
0.143mg
3%
Polyunsaturated fat
1.212g
1.637g
3%
Calories
172kcal
131kcal
2%
Carbs
7.39g
0g
2%
Saturated fat
0.85g
1.282g
2%
Fats
4.48g
4.84g
1%
Cholesterol
56mg
60mg
1%
Magnesium
37mg
41mg
1%
Protein per 100 calories
14g
16g
N/A
Calories per 10 g protein
72kcal
64kcal
N/A
Weight per 100 calories
58g
76g
N/A
Unsaturated / Saturated Fat ratio
2.6
2.2
N/A
Net carbs
7.39g
0g
N/A
Vitamin K
0.1µg
0%
Monounsaturated fat
1.014g
1.182g
0%
Tryptophan
0.267mg
0.228mg
0%
Threonine
1.025mg
0.892mg
0%
Isoleucine
1.036mg
0.938mg
0%
Leucine
1.676mg
1.654mg
0%
Lysine
1.779mg
1.869mg
0%
Methionine
0.537mg
0.602mg
0%
Phenylalanine
0.853mg
0.794mg
0%
Valine
1.04mg
1.048mg
0%
Histidine
0.457mg
0.599mg
0%
Omega-3 - EPA
0.276g
0.538g
N/A
Omega-3 - DHA
0.506g
0.911g
N/A
Omega-3 - DPA
0.044g
0.029g
N/A
Macronutrient Comparison
Macronutrient breakdown side-by-side comparison
3
24%
4%
7%
61%
3%
Protein:
23.8 g
Fats:
4.48 g
Carbs:
7.39 g
Water:
61.15 g
Other:
3.18 g
2
20%
5%
73%
Protein:
20.35 g
Fats:
4.84 g
Carbs:
0 g
Water:
73.37 g
Other:
1.44 g
Contains
more
Protein Protein
+17%
Contains
more
Carbs Carbs
+∞%
Contains
more
Other Other
+120.8%
Contains
more
Water Water
+20%
Fat Type Comparison
Fat type breakdown side-by-side comparison
1
28%
33%
39%
Saturated fat:
Sat. Fat
0.85 g
Monounsaturated fat:
Mono. Fat
1.014 g
Polyunsaturated fat:
Poly. Fat
1.212 g
2
31%
29%
40%
Saturated fat:
Sat. Fat
1.282 g
Monounsaturated fat:
Mono. Fat
1.182 g
Polyunsaturated fat:
Poly. Fat
1.637 g
Contains
less
Sat. Fat Saturated fat
-33.7%
Contains
more
Mono. Fat Monounsaturated fat
+16.6%
Contains
more
Poly. Fat Polyunsaturated fat
+35.1%