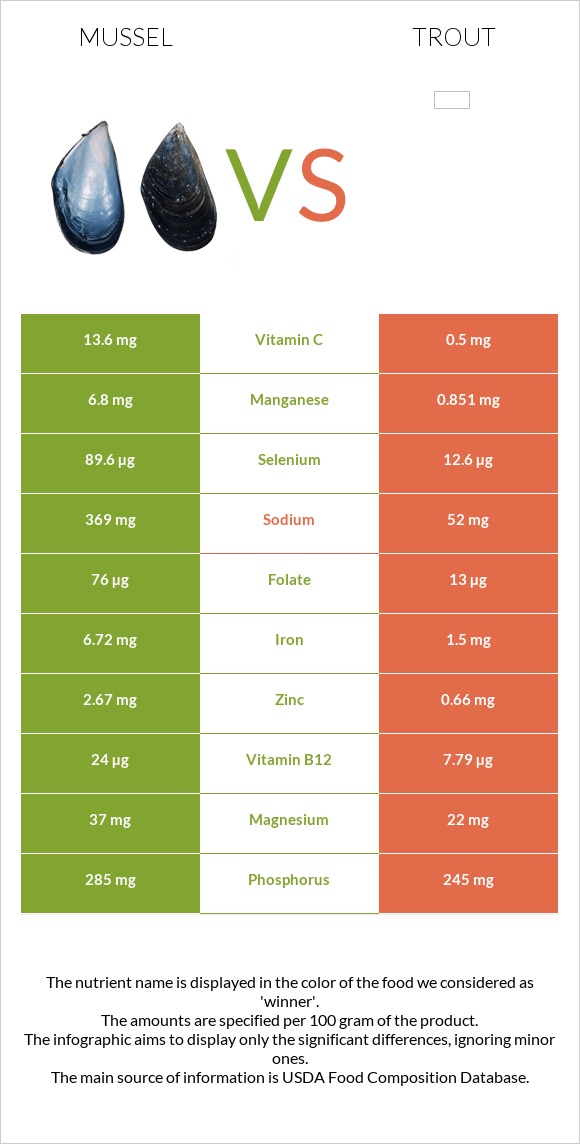
What are the main differences between mussels and trout? Mussels is richer in vitamin B12, manganese, selenium, iron, vitamin B2, zinc, and folate, yet trout is richer in vitamin B3, vitamin B6, and vitamin B5. Mussels's daily need coverage for vitamin B12 is 829% higher. Mussels has 523 times more manganese than trout. Mussels has 6.8mg of manganese, while trout has 0.013mg. Trout has a lower glycemic index than mussels. We used Mollusks, mussel, blue, cooked, moist heat and Fish, trout, rainbow, farmed, cooked, dry heat types in this comparison.
Infographic
Mineral Comparison
Mineral comparison score is based on the number of minerals by which one or the other food is richer. The "coverage" charts below show how much of the daily needs can be covered by 300 grams of the food.
6
100 g
300 g
3 oz - 85g
Magnesium
Magnesium
Calcium
Calcium
Potassium
Potassium
Iron
Iron
Copper
Copper
Zinc
Zinc
Phosphorus
Phosphorus
Sodium
Sodium
Manganese
Manganese
Selenium
Selenium
26%
9.9%
24%
252%
50%
73%
122%
48%
887%
489%
2
100 g
300 g
1 fillet - 71g 3 oz - 85g
Magnesium
Magnesium
Calcium
Calcium
Potassium
Potassium
Iron
Iron
Copper
Copper
Zinc
Zinc
Phosphorus
Phosphorus
Sodium
Sodium
Manganese
Manganese
Selenium
Selenium
21%
9%
40%
14%
18%
15%
116%
8%
1.7%
153%
Vitamin Comparison
Vitamin comparison score is based on the number of vitamins by which one or the other food is richer. The "coverage" charts below show how much of the daily needs can be covered by 300 grams of the food.
5
100 g
300 g
3 oz - 85g
Vitamin C
Vit. C
Vitamin D
Vit. D
Vitamin A
Vit. A
Vitamin E
Vit. E
Vitamin B1
Vit. B1
Vitamin B2
Vit. B2
Vitamin B3
Vit. B3
Vitamin B5
Vit. B5
Vitamin B6
Vit. B6
Vitamin B12
Vit. B12
Vitamin K
Vit. K
Folate
Folate
45%
0%
30%
0%
75%
97%
56%
57%
23%
3000%
0%
57%
6
100 g
300 g
1 fillet - 71g 3 oz - 85g
Vitamin C
Vit. C
Vitamin D
Vit. D
Vitamin A
Vit. A
Vitamin E
Vit. E
Vitamin B1
Vit. B1
Vitamin B2
Vit. B2
Vitamin B3
Vit. B3
Vitamin B5
Vit. B5
Vitamin B6
Vit. B6
Vitamin B12
Vit. B12
Vitamin K
Vit. K
Folate
Folate
9.7%
285%
33%
56%
36%
25%
125%
119%
89%
514%
0.25%
9%
All nutrients comparison - raw data values
Nutrient
DV% diff.
Vitamin B12
24µg
4.11µg
829%
Manganese
6.8mg
0.013mg
295%
Selenium
89.6µg
28.1µg
112%
Vitamin D*
759 IU
95%
Vitamin D
19µg
95%
Iron
6.72mg
0.36mg
80%
Vitamin B2
0.42mg
0.107mg
24%
Vitamin B3
3mg
6.646mg
23%
Vitamin B6
0.1mg
0.386mg
22%
Vitamin B5
0.95mg
1.99mg
21%
Zinc
2.67mg
0.54mg
19%
Vitamin E
2.79mg
19%
Folate
76µg
12µg
16%
Choline
77.6mg
14%
Sodium
369mg
61mg
13%
Vitamin B1
0.3mg
0.143mg
13%
Vitamin C
13.6mg
2.9mg
12%
Copper
0.149mg
0.055mg
10%
Cholesterol
56mg
70mg
5%
Potassium
268mg
450mg
5%
Fats
4.48g
7.38g
4%
Saturated fat
0.85g
1.651g
4%
Polyunsaturated fat
1.212g
1.799g
4%
Monounsaturated fat
1.014g
2.363g
3%
Carbs
7.39g
0g
2%
Magnesium
37mg
30mg
2%
Phosphorus
285mg
270mg
2%
Vitamin A
91µg
100µg
1%
Calories
172kcal
168kcal
0%
Protein
23.8g
23.8g
0%
Protein per 100 calories
14g
14g
N/A
Calories per 10 g protein
72kcal
71kcal
N/A
Weight per 100 calories
58g
60g
N/A
Unsaturated / Saturated Fat ratio
2.6
2.5
N/A
Net carbs
7.39g
0g
N/A
Calcium
33mg
30mg
0%
Vitamin K
0.1µg
0%
Trans fat
0.056g
N/A
Tryptophan
0.267mg
0.279mg
0%
Threonine
1.025mg
1.092mg
0%
Isoleucine
1.036mg
1.148mg
0%
Leucine
1.676mg
2.025mg
0%
Lysine
1.779mg
2.287mg
0%
Methionine
0.537mg
0.738mg
0%
Phenylalanine
0.853mg
0.973mg
0%
Valine
1.04mg
1.283mg
0%
Histidine
0.457mg
0.733mg
0%
Omega-3 - EPA
0.276g
0.259g
N/A
Omega-3 - DHA
0.506g
0.616g
N/A
Omega-3 - DPA
0.044g
0.109g
N/A
Omega-6 - Eicosadienoic acid
0.047g
N/A
Macronutrient Comparison
Macronutrient breakdown side-by-side comparison
2
24%
4%
7%
61%
3%
Protein:
23.8 g
Fats:
4.48 g
Carbs:
7.39 g
Water:
61.15 g
Other:
3.18 g
2
24%
7%
69%
Protein:
23.8 g
Fats:
7.38 g
Carbs:
0 g
Water:
68.72 g
Other:
0.1 g
Contains
more
Carbs Carbs
+∞%
Contains
more
Other Other
+3080%
Contains
more
Fats Fats
+64.7%
Contains
more
Water Water
+12.4%
Fat Type Comparison
Fat type breakdown side-by-side comparison
1
28%
33%
39%
Saturated fat:
Sat. Fat
0.85 g
Monounsaturated fat:
Mono. Fat
1.014 g
Polyunsaturated fat:
Poly. Fat
1.212 g
2
28%
41%
31%
Saturated fat:
Sat. Fat
1.651 g
Monounsaturated fat:
Mono. Fat
2.363 g
Polyunsaturated fat:
Poly. Fat
1.799 g
Contains
less
Sat. Fat Saturated fat
-48.5%
Contains
more
Mono. Fat Monounsaturated fat
+133%
Contains
more
Poly. Fat Polyunsaturated fat
+48.4%