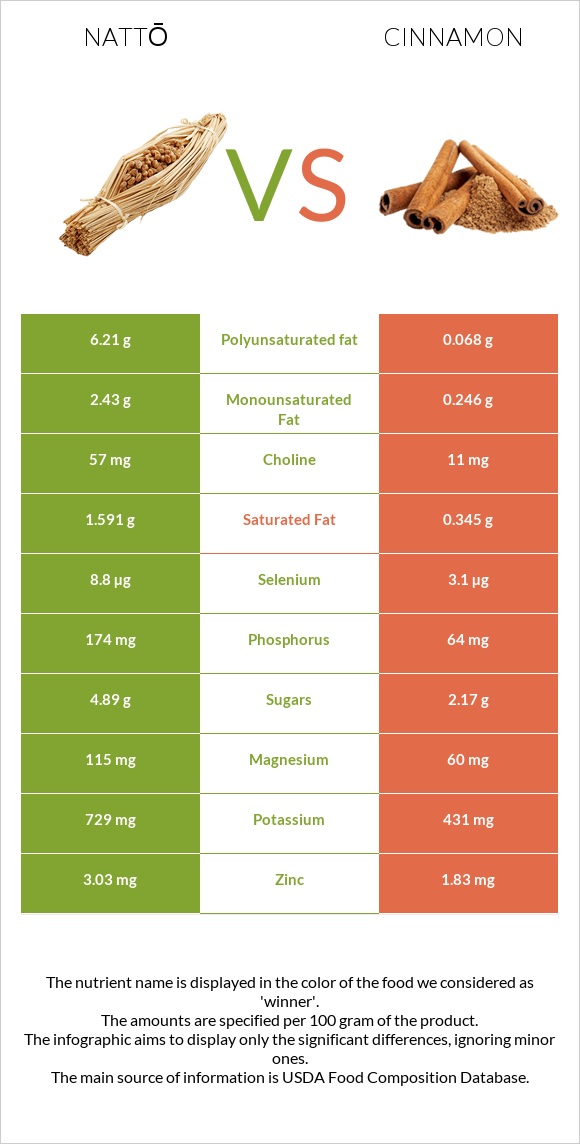
Summary of differences between nattō and cinnamon Nattō has more copper, phosphorus, magnesium, vitamin B1, vitamin B2, and zinc, while cinnamon has more manganese, fiber, calcium, and vitamin E. Cinnamon covers your daily need for manganese, 693% more than nattō. Nattō contains 7 times more vitamin B1 than cinnamon. While nattō contains 0.16mg of vitamin B1, cinnamon contains only 0.022mg. These are the specific foods used in this comparison Natto and Spices, cinnamon, ground .
Infographic
Mineral Comparison
Mineral comparison score is based on the number of minerals by which one or the other food is richer. The "coverage" charts below show how much of the daily needs can be covered by 300 grams of the food.
7
100 g
300 g
1 cup - 175g
Magnesium
Magnesium
Calcium
Calcium
Potassium
Potassium
Iron
Iron
Copper
Copper
Zinc
Zinc
Phosphorus
Phosphorus
Sodium
Sodium
Manganese
Manganese
Selenium
Selenium
82%
65%
64%
323%
222%
83%
75%
0.91%
199%
48%
2
100 g
300 g
0.25 tsp - 0.5g 1 tbsp - 7.8g
Magnesium
Magnesium
Calcium
Calcium
Potassium
Potassium
Iron
Iron
Copper
Copper
Zinc
Zinc
Phosphorus
Phosphorus
Sodium
Sodium
Manganese
Manganese
Selenium
Selenium
43%
301%
38%
312%
113%
50%
27%
1.3%
2278%
17%
Vitamin Comparison
Vitamin comparison score is based on the number of vitamins by which one or the other food is richer. The "coverage" charts below show how much of the daily needs can be covered by 300 grams of the food.
4
100 g
300 g
1 cup - 175g
Vitamin C
Vit. C
Vitamin D
Vit. D
Vitamin A
Vit. A
Vitamin E
Vit. E
Vitamin B1
Vit. B1
Vitamin B2
Vit. B2
Vitamin B3
Vit. B3
Vitamin B5
Vit. B5
Vitamin B6
Vit. B6
Vitamin B12
Vit. B12
Vitamin K
Vit. K
Folate
Folate
43%
0%
0%
0.2%
40%
44%
0%
13%
30%
0%
58%
6%
6
100 g
300 g
0.25 tsp - 0.5g 1 tbsp - 7.8g
Vitamin C
Vit. C
Vitamin D
Vit. D
Vitamin A
Vit. A
Vitamin E
Vit. E
Vitamin B1
Vit. B1
Vitamin B2
Vit. B2
Vitamin B3
Vit. B3
Vitamin B5
Vit. B5
Vitamin B6
Vit. B6
Vitamin B12
Vit. B12
Vitamin K
Vit. K
Folate
Folate
13%
0%
5%
46%
5.5%
9.5%
25%
21%
36%
0%
78%
4.5%
All nutrients comparison - raw data values
Nutrient
DV% diff.
Manganese
1.528mg
17.466mg
693%
Fiber
5.4g
53.1g
191%
Calcium
217mg
1002mg
79%
Polyunsaturated fat
6.21g
0.068g
41%
Copper
0.667mg
0.339mg
36%
Protein
19.4g
3.99g
31%
Carbs
12.68g
80.59g
23%
Phosphorus
174mg
64mg
16%
Fats
11g
1.24g
15%
Vitamin E
0.01mg
2.32mg
15%
Magnesium
115mg
60mg
13%
Vitamin B1
0.16mg
0.022mg
12%
Zinc
3.03mg
1.83mg
11%
Vitamin B2
0.19mg
0.041mg
11%
Vitamin C
13mg
3.8mg
10%
Selenium
8.8µg
3.1µg
10%
Potassium
729mg
431mg
9%
Vitamin B3
0mg
1.332mg
8%
Choline
57mg
11mg
8%
Vitamin K
23.1µg
31.2µg
7%
Saturated fat
1.591g
0.345g
6%
Monounsaturated fat
2.43g
0.246g
5%
Iron
8.6mg
8.32mg
3%
Vitamin B5
0.215mg
0.358mg
3%
Calories
211kcal
247kcal
2%
Vitamin A
0µg
15µg
2%
Vitamin B6
0.13mg
0.158mg
2%
Folate
8µg
6µg
1%
Fructose
1.11g
1%
Protein per 100 calories
9.2g
1.6g
N/A
Calories per 10 g protein
109kcal
619kcal
N/A
Weight per 100 calories
47g
40g
N/A
Unsaturated / Saturated Fat ratio
5.4
0.91
N/A
Net carbs
7.28g
27.49g
N/A
Sugar
4.89g
2.17g
N/A
Sodium
7mg
10mg
0%
Tryptophan
0.223mg
0.049mg
0%
Threonine
0.813mg
0.136mg
0%
Isoleucine
0.931mg
0.146mg
0%
Leucine
1.509mg
0.253mg
0%
Lysine
1.145mg
0.243mg
0%
Methionine
0.208mg
0.078mg
0%
Phenylalanine
0.941mg
0.146mg
0%
Valine
1.018mg
0.224mg
0%
Histidine
0.512mg
0.117mg
0%
Omega-3 - ALA
0.011g
N/A
Macronutrient Comparison
Macronutrient breakdown side-by-side comparison
3
19%
11%
13%
55%
2%
Protein:
19.4 g
Fats:
11 g
Carbs:
12.68 g
Water:
55.02 g
Other:
1.9 g
2
4%
81%
11%
4%
Protein:
3.99 g
Fats:
1.24 g
Carbs:
80.59 g
Water:
10.58 g
Other:
3.6 g
Contains
more
Protein Protein
+386.2%
Contains
more
Fats Fats
+787.1%
Contains
more
Water Water
+420%
Contains
more
Carbs Carbs
+535.6%
Contains
more
Other Other
+89.5%
Fat Type Comparison
Fat type breakdown side-by-side comparison
2
16%
24%
61%
Saturated fat:
Sat. Fat
1.591 g
Monounsaturated fat:
Mono. Fat
2.43 g
Polyunsaturated fat:
Poly. Fat
6.21 g
1
52%
37%
10%
Saturated fat:
Sat. Fat
0.345 g
Monounsaturated fat:
Mono. Fat
0.246 g
Polyunsaturated fat:
Poly. Fat
0.068 g
Contains
more
Mono. Fat Monounsaturated fat
+887.8%
Contains
more
Poly. Fat Polyunsaturated fat
+9032.4%
Contains
less
Sat. Fat Saturated fat
-78.3%