Nutmeg vs. Allspice — Health Impact and Nutrition Comparison


Summary
Nutmeg is 2 times higher in calories and 4 times higher in fats, while allspice contains 1.5 more carbohydrates.
Nutmeg is richer in vitamin B1, zinc, phosphorus, and copper. Allspice is higher in vitamin A, calcium, potassium, and iron. Allspice provides 13 times more vitamin C than nutmeg.
Introduction
In this article, we will be comparing nutmeg and allspice, focusing on their nutritional composition and health impact (1, 2).
Actual Differences
Allspice is the dried, unripe berry of the Pimenta dioica plant that originated from Jamaica, while nutmeg is the fruit of Myristica fragrans of Indonesian origin.
Nutmeg has a simple, pungent, and slightly spicy flavor. Allspice has a more complex aroma: it resembles a mixture of pepper, nutmeg, cloves, and cinnamon.
Use
Nutmeg and allspice have similar uses in the kitchen.
Nutmeg is commonly used in both sweet and savory dishes, such as pies, custards, puddings, spice blends, and certain meat dishes. It's also used in some beverages like eggnog.
Allspice is also used in both sweet and savory dishes, including cakes, cookies, pickles, stews, marinades, and jerk seasoning blends. In some cultures, it's also used to flavor beverages and liqueurs.
Both spices are usually sold in ground or powdered form; however, nutmeg can also come as a whole seed, while allspice is a dried whole berry.
Nutrition
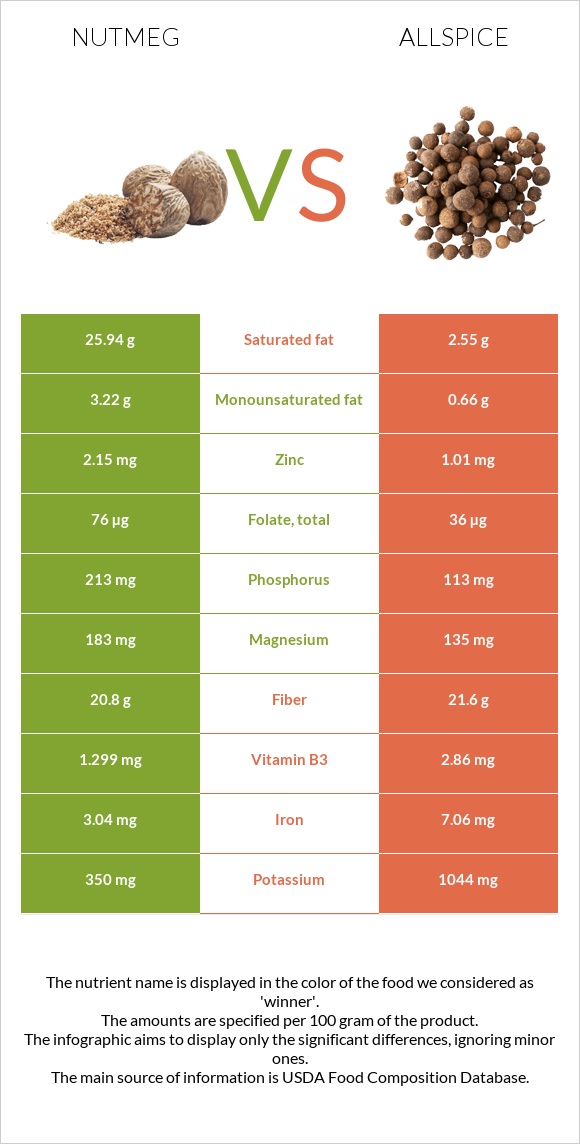
The nutritional infographics below are presented for 100g servings of ground nutmeg and allspice.
However, these spices are naturally not consumed in such large amounts. One average serving size for allspice and nutmeg is 0.25 teaspoon or 0.5g.
Allspice consists of 72% carbohydrates and 9% fats, while nutmeg is made up of 49% carbohydrates and 36% fats.
@macronutrient
Calories
Nutmeg is high in calories, while allspice is a medium-calorie food.
Nutmeg is 2 times higher in calories than allspice.
Nutmeg provides 525 calories per 100g (2.6 calories per serving), and allspice contains 263 calories per 100g (1.3 calories per serving).
However, when added to dishes, these barely change the caloric value of the food.
Minerals
Nutmeg and allspice are rich in minerals and can be a way of adding micronutrients to a dish.
Allspice is 3 times richer in potassium, 4 times richer in calcium, and 2 times richer in calcium, while nutmeg contains 2 times more zinc and 2 times more copper and phosphorus.
Allspice is also richer in selenium, whereas nutmeg is higher in magnesium and lower in sodium.
Mineral Comparison
Contains
more
MagnesiumMagnesium
+35.6%
Contains
more
CopperCopper
+85.7%
Contains
more
ZincZinc
+112.9%
Contains
more
PhosphorusPhosphorus
+88.5%
Contains
less
SodiumSodium
-79.2%
Contains
more
CalciumCalcium
+259.2%
Contains
more
PotassiumPotassium
+198.3%
Contains
more
IronIron
+132.2%
Contains
more
SeleniumSelenium
+68.8%
Vitamins
Although nutmeg and allspice are packed with vitamins, allspice has an overall higher vitamin content.
Allspice is richer in vitamins A, C, B2, B3, B6. It is 13 times higher in vitamin C and more than 5 times higher in vitamin A than nutmeg.
However, nutmeg is 3 times higher in vitamin B1 and 2 times richer in folate or vitamin B9.
Vitamin Comparison
Contains
more
Vitamin B1Vitamin B1
+242.6%
Contains
more
FolateFolate
+111.1%
Contains
more
Vitamin CVitamin C
+1206.7%
Contains
more
Vitamin AVitamin A
+440%
Contains
more
Vitamin B2Vitamin B2
+10.5%
Contains
more
Vitamin B3Vitamin B3
+120.2%
Contains
more
Vitamin B6Vitamin B6
+31.3%
Fats
Nutmeg is 4 times higher in fats than allspice. It contains 0.18g of fats per serving, while the serving size of allspice provides 0.04g.
However, allspice is richer in polyunsaturated fats, while nutmeg is significantly higher in saturated fats.
Both nutmeg and allspice do not contain any amount of cholesterol.
Fat Type Comparison
Contains
more
Mono. FatMonounsaturated fat
+387.9%
Contains
less
Sat. FatSaturated fat
-90.2%
Contains
more
Poly. FatPolyunsaturated fat
+574.3%
Carbohydrates
Allspice contains more carbs than nutmeg. It has 0.36g per 0.5g serving or 72.1g of carbs per 100g, whereas nutmeg has 0.25g per the same serving size of 49.3g per 100g. This difference is mostly due to net carbs since they contain similar amounts of dietary fiber.
Both nutmeg and allspice are rich in fiber. Allspice is only 0.8g higher in fiber than nutmeg. Allspice is especially richer in soluble fiber.
Health impact
Anti-inflammatory Effects
Inflammation is linked to several health conditions, such as diabetes, heart disease, and arthritis (3).
Allspice reduces inflammation by inhibiting inflammation markers (4).
Nutmeg contains anti-inflammatory chemicals called monoterpenes and macelignans (5). However, more studies are needed to confirm the anti-inflammatory effects of nutmeg and allspice in humans.
Antibacterial Properties
Nutmeg and allspice show antibacterial effects on potentially harmful bacteria.
Nutmeg extract is effective against Aggregatibacter actinomycetemcomitans Streptococcus mutans, which are known to cause dental cavities and gum infections (6).
Allspice provides antibacterial effects on S. aureus, Salmonella, and E. coli (7).
These effects are due to eugenol content, which is a chemical that damages bacterial cell walls (5, 7).
Blood Sugar Control and Diabetes
A study shows that high-dose nutmeg extract can reduce blood sugar levels and promote pancreatic function (8).
Allspice and nutmeg contain eugenol that protects pancreatic islets, thus managing blood sugar levels (9).
References
- https://fdc.nal.usda.gov/fdc-app.html#/food-details/171326/nutrients
- https://fdc.nal.usda.gov/fdc-app.html#/food-details/171315/nutrients
- https://www.ncbi.nlm.nih.gov/books/NBK493173/
- https://www.ncbi.nlm.nih.gov/pmc/articles/PMC3891794/
- https://www.ncbi.nlm.nih.gov/pmc/articles/PMC5222521/
- https://www.ncbi.nlm.nih.gov/pmc/articles/PMC3434417/
- https://www.ncbi.nlm.nih.gov/pmc/articles/PMC6530202/
- https://pubmed.ncbi.nlm.nih.gov/31063201/
- https://pubmed.ncbi.nlm.nih.gov/32831835/

Infographic
All nutrients comparison - raw data values
| Nutrient | |
|
DV% diff. |
| Saturated fat | 25.94g | 2.55g | 106% |
| Copper | 1.027mg | 0.553mg | 53% |
| Iron | 3.04mg | 7.06mg | 50% |
| Calcium | 184mg | 661mg | 48% |
| Fats | 36.31g | 8.69g | 42% |
| Vitamin C | 3mg | 39.2mg | 40% |
| Potassium | 350mg | 1044mg | 20% |
| Vitamin B1 | 0.346mg | 0.101mg | 20% |
| Phosphorus | 213mg | 113mg | 14% |
| Calories | 525kcal | 263kcal | 13% |
| Polyunsaturated fat | 0.35g | 2.36g | 13% |
| Magnesium | 183mg | 135mg | 11% |
| Zinc | 2.15mg | 1.01mg | 10% |
| Vitamin B3 | 1.299mg | 2.86mg | 10% |
| Folate | 76µg | 36µg | 10% |
| Carbs | 49.29g | 72.12g | 8% |
| Monounsaturated fat | 3.22g | 0.66g | 6% |
| Vitamin B6 | 0.16mg | 0.21mg | 4% |
| Fiber | 20.8g | 21.6g | 3% |
| Sodium | 16mg | 77mg | 3% |
| Vitamin A | 5µg | 27µg | 2% |
| Manganese | 2.9mg | 2.943mg | 2% |
| Selenium | 1.6µg | 2.7µg | 2% |
| Choline | 8.8mg | 2% | |
| Protein | 5.84g | 6.09g | 1% |
| Protein per 100 calories | 1.1g | 2.3g | N/A |
| Calories per 10 g protein | 899kcal | 432kcal | N/A |
| Weight per 100 calories | 19g | 38g | N/A |
| Unsaturated / Saturated Fat ratio | 0.14 | 1.2 | N/A |
| Net carbs | 28.49g | 50.52g | N/A |
| Sugar | 2.99g | N/A | |
| Vitamin B2 | 0.057mg | 0.063mg | 0% |
Macronutrient Comparison
| Contains more FatsFats | +317.8% |
| Contains more CarbsCarbs | +46.3% |
| Contains more WaterWater | +35.8% |
| Contains more OtherOther | +99.1% |
People also compare


References
All the values for which the sources are not specified explicitly are taken from FDA’s Food Central. The exact link to the food presented on this page can be found below.
- Nutmeg - https://fdc.nal.usda.gov/fdc-app.html#/food-details/171326/nutrients
- Allspice - https://fdc.nal.usda.gov/fdc-app.html#/food-details/171315/nutrients
All the Daily Values are presented for males aged 31-50, for 2000-calorie diets.