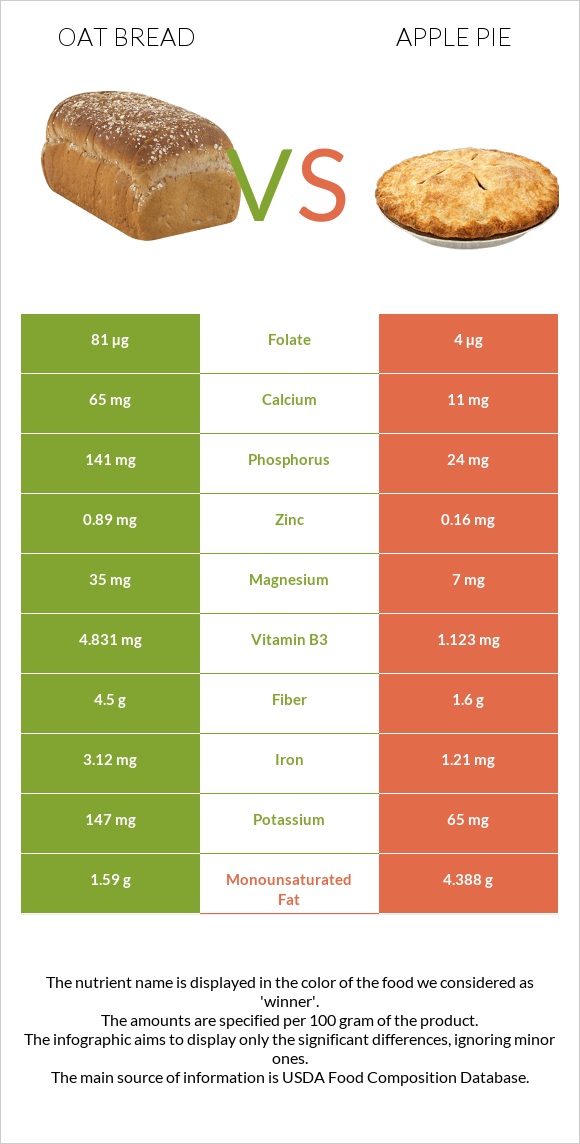
Significant differences between oat bread and apple pie The amount of vitamin B1, manganese, iron, vitamin B3, folate, phosphorus, vitamin B2, fiber, and copper in oat bread is higher than in apple pie. Oat bread covers your daily vitamin B1 needs 31% more than apple pie. Apple pie has 20 times less folate than oat bread. Oat bread has 81µg of folate, while apple pie has 4µg. Oat bread contains less saturated fat. Oat bread has a higher glycemic index. The glycemic index of oat bread is 64, while the glycemic index of apple pie is 41. Specific food types used in this comparison are Bread, oat bran and Pie, apple, commercially prepared, unenriched flour .
Infographic
Mineral Comparison
Mineral comparison score is based on the number of minerals by which one or the other food is richer. The "coverage" charts below show how much of the daily needs can be covered by 300 grams of the food.
9
100 g
300 g
1 oz - 28.35g 1 slice - 30g
Magnesium
Magnesium
Calcium
Calcium
Potassium
Potassium
Iron
Iron
Copper
Copper
Zinc
Zinc
Phosphorus
Phosphorus
Sodium
Sodium
Manganese
Manganese
Selenium
Selenium
25%
20%
13%
117%
45%
24%
60%
46%
102%
164%
1
100 g
300 g
1 oz - 28.35g 1 piece (1/6 of 8" pie) - 117g 1 piece (1/8 of 9" dia) - 125g
Magnesium
Magnesium
Calcium
Calcium
Potassium
Potassium
Iron
Iron
Copper
Copper
Zinc
Zinc
Phosphorus
Phosphorus
Sodium
Sodium
Manganese
Manganese
Selenium
Selenium
5%
3.3%
5.7%
45%
15%
4.4%
10%
35%
24%
0%
Vitamin Comparison
Vitamin comparison score is based on the number of vitamins by which one or the other food is richer. The "coverage" charts below show how much of the daily needs can be covered by 300 grams of the food.
8
100 g
300 g
1 oz - 28.35g 1 slice - 30g
Vitamin C
Vit. C
Vitamin D
Vit. D
Vitamin A
Vit. A
Vitamin E
Vit. E
Vitamin B1
Vit. B1
Vitamin B2
Vit. B2
Vitamin B3
Vit. B3
Vitamin B5
Vit. B5
Vitamin B6
Vit. B6
Vitamin B12
Vit. B12
Vitamin K
Vit. K
Folate
Folate
0%
0%
0.67%
8.8%
126%
80%
91%
35%
17%
0%
3%
61%
3
100 g
300 g
1 oz - 28.35g 1 piece (1/6 of 8" pie) - 117g 1 piece (1/8 of 9" dia) - 125g
Vitamin C
Vit. C
Vitamin D
Vit. D
Vitamin A
Vit. A
Vitamin E
Vit. E
Vitamin B1
Vit. B1
Vitamin B2
Vit. B2
Vitamin B3
Vit. B3
Vitamin B5
Vit. B5
Vitamin B6
Vit. B6
Vitamin B12
Vit. B12
Vitamin K
Vit. K
Folate
Folate
11%
0%
9.7%
0%
34%
36%
21%
7.1%
8.8%
1.3%
0%
3%
All nutrients comparison - raw data values
Nutrient
DV% diff.
Selenium
30µg
55%
Vitamin B1
0.504mg
0.134mg
31%
Manganese
0.779mg
0.182mg
26%
Iron
3.12mg
1.21mg
24%
Vitamin B3
4.831mg
1.123mg
23%
Folate
81µg
4µg
19%
Protein
10.4g
1.9g
17%
Phosphorus
141mg
24mg
17%
Vitamin B2
0.346mg
0.158mg
14%
Saturated fat
0.697g
3.797g
14%
Fiber
4.5g
1.6g
12%
Fats
4.4g
11g
10%
Copper
0.135mg
0.046mg
10%
Vitamin B5
0.581mg
0.119mg
9%
Magnesium
35mg
7mg
7%
Zinc
0.89mg
0.16mg
7%
Monounsaturated fat
1.59g
4.388g
7%
Calcium
65mg
11mg
5%
Vitamin C
0mg
3.2mg
4%
Sodium
353mg
266mg
4%
Vitamin A
2µg
29µg
3%
Vitamin E
0.44mg
3%
Vitamin B6
0.073mg
0.038mg
3%
Choline
18.7mg
3%
Polyunsaturated fat
1.694g
2.198g
3%
Carbs
39.8g
34g
2%
Potassium
147mg
65mg
2%
Vitamin K
1.2µg
1%
Calories
236kcal
237kcal
0%
Protein per 100 calories
4.4g
0.8g
N/A
Calories per 10 g protein
227kcal
1247kcal
N/A
Weight per 100 calories
42g
42g
N/A
Unsaturated / Saturated Fat ratio
4.7
1.7
N/A
Net carbs
35.3g
32.4g
N/A
Sugar
7.7g
N/A
Vitamin B12
0µg
0.01µg
0%
Tryptophan
0.131mg
0.026mg
0%
Threonine
0.299mg
0.054mg
0%
Isoleucine
0.399mg
0.073mg
0%
Leucine
0.733mg
0.129mg
0%
Lysine
0.297mg
0.07mg
0%
Methionine
0.179mg
0.032mg
0%
Phenylalanine
0.518mg
0.088mg
0%
Valine
0.461mg
0.084mg
0%
Histidine
0.225mg
0.038mg
0%
Macronutrient Comparison
Macronutrient breakdown side-by-side comparison
3
10%
4%
40%
44%
Protein:
10.4 g
Fats:
4.4 g
Carbs:
39.8 g
Water:
44 g
Other:
1.4 g
2
2%
11%
34%
52%
Protein:
1.9 g
Fats:
11 g
Carbs:
34 g
Water:
52.2 g
Other:
0.9 g
Contains
more
Protein Protein
+447.4%
Contains
more
Carbs Carbs
+17.1%
Contains
more
Other Other
+55.6%
Contains
more
Fats Fats
+150%
Contains
more
Water Water
+18.6%
Fat Type Comparison
Fat type breakdown side-by-side comparison
1
18%
40%
43%
Saturated fat:
Sat. Fat
0.697 g
Monounsaturated fat:
Mono. Fat
1.59 g
Polyunsaturated fat:
Poly. Fat
1.694 g
2
37%
42%
21%
Saturated fat:
Sat. Fat
3.797 g
Monounsaturated fat:
Mono. Fat
4.388 g
Polyunsaturated fat:
Poly. Fat
2.198 g
Contains
less
Sat. Fat Saturated fat
-81.6%
Contains
more
Mono. Fat Monounsaturated fat
+176%
Contains
more
Poly. Fat Polyunsaturated fat
+29.8%