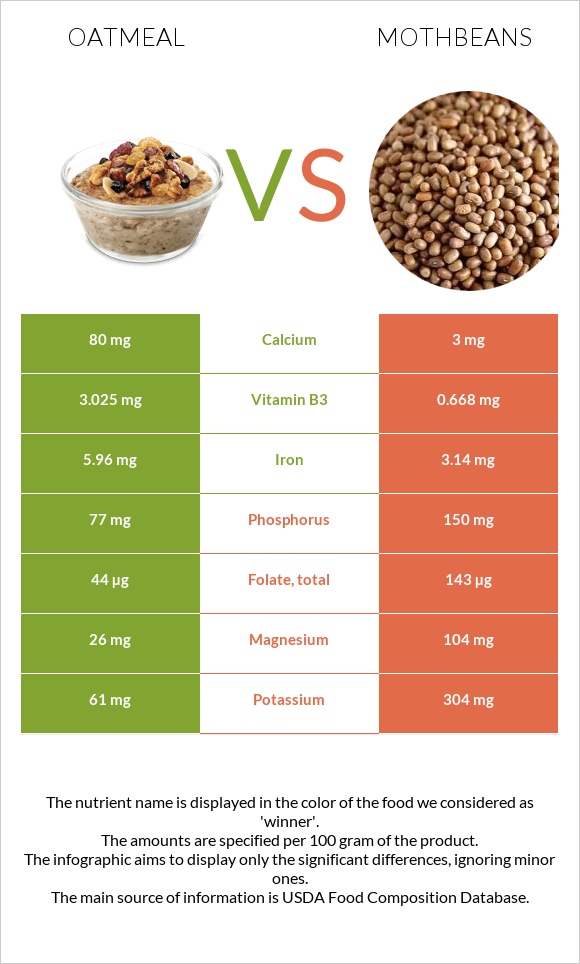
Important differences between oatmeal and mothbeans Oatmeal has more iron, vitamin B6, vitamin B2, vitamin B3, vitamin B1, and vitamin A; however, mothbeans has more folate, magnesium, copper, and phosphorus. Oatmeal's daily need coverage for iron is 35% more. Oatmeal has 43 times more vitamin A than mothbeans. Oatmeal has 433 IU of vitamin A, while mothbeans has 10 IU. Oatmeal has a higher glycemic index than mothbeans. The food varieties used in the comparison are Cereals, oats, instant, fortified, plain, prepared with water (boiling water added or microwaved) and Mothbeans, mature seeds, cooked, boiled, without salt .
Infographic
Mineral Comparison
Mineral comparison score is based on the number of minerals by which one or the other food is richer. The "coverage" charts below show how much of the daily needs can be covered by 300 grams of the food.
3
100 g
300 g
1 oz, dry, yields - 177g 1 packet, dry, yields - 177g 1 cup, cooked - 234g 1 cup, dry, yields - 501g
Magnesium
Magnesium
Calcium
Calcium
Potassium
Potassium
Iron
Iron
Copper
Copper
Zinc
Zinc
Phosphorus
Phosphorus
Sodium
Sodium
Manganese
Manganese
Selenium
Selenium
19%
24%
5.4%
224%
22%
17%
33%
6.4%
73%
27%
5
100 g
300 g
1 cup - 177g
Magnesium
Magnesium
Calcium
Calcium
Potassium
Potassium
Iron
Iron
Copper
Copper
Zinc
Zinc
Phosphorus
Phosphorus
Sodium
Sodium
Manganese
Manganese
Selenium
Selenium
74%
0.9%
27%
118%
55%
16%
64%
1.3%
69%
15%
Vitamin Comparison
Vitamin comparison score is based on the number of vitamins by which one or the other food is richer. The "coverage" charts below show how much of the daily needs can be covered by 300 grams of the food.
7
100 g
300 g
1 oz, dry, yields - 177g 1 packet, dry, yields - 177g 1 cup, cooked - 234g 1 cup, dry, yields - 501g
Vitamin C
Vit. C
Vitamin D
Vit. D
Vitamin A
Vit. A
Vitamin E
Vit. E
Vitamin B1
Vit. B1
Vitamin B2
Vit. B2
Vitamin B3
Vit. B3
Vitamin B5
Vit. B5
Vitamin B6
Vit. B6
Vitamin B12
Vit. B12
Vitamin K
Vit. K
Folate
Folate
0%
0%
43%
1.4%
65%
50%
57%
19%
67%
0%
1%
33%
3
100 g
300 g
1 cup - 177g
Vitamin C
Vit. C
Vitamin D
Vit. D
Vitamin A
Vit. A
Vitamin E
Vit. E
Vitamin B1
Vit. B1
Vitamin B2
Vit. B2
Vitamin B3
Vit. B3
Vitamin B5
Vit. B5
Vitamin B6
Vit. B6
Vitamin B12
Vit. B12
Vitamin K
Vit. K
Folate
Folate
3.3%
0%
0.33%
0%
31%
5.3%
13%
23%
21%
0%
0%
107%
All nutrients comparison - raw data values
Nutrient
DV% diff.
Iron
5.96mg
3.14mg
35%
Folate
44µg
143µg
25%
Magnesium
26mg
104mg
19%
Vitamin B2
0.215mg
0.023mg
15%
Vitamin B3
3.025mg
0.668mg
15%
Vitamin B6
0.29mg
0.093mg
15%
Vitamin A
130µg
1µg
14%
Protein
2.37g
7.81g
11%
Copper
0.066mg
0.164mg
11%
Vitamin B1
0.26mg
0.124mg
11%
Phosphorus
77mg
150mg
10%
Calcium
80mg
3mg
8%
Potassium
61mg
304mg
7%
Fiber
1.7g
7%
Starch
10.37g
4%
Selenium
5µg
2.8µg
4%
Carbs
11.67g
20.96g
3%
Calories
68kcal
117kcal
2%
Sodium
49mg
10mg
2%
Fats
1.36g
0.55g
1%
Vitamin C
0mg
1mg
1%
Manganese
0.558mg
0.527mg
1%
Vitamin B5
0.317mg
0.391mg
1%
Choline
4.7mg
1%
Monounsaturated fat
0.391g
0.044g
1%
Polyunsaturated fat
0.426g
0.256g
1%
Protein per 100 calories
3.5g
6.7g
N/A
Calories per 10 g protein
287kcal
150kcal
N/A
Weight per 100 calories
147g
85g
N/A
Net carbs
9.97g
20.96g
N/A
Sugar
0.46g
N/A
Zinc
0.62mg
0.59mg
0%
Vitamin E
0.07mg
0%
Vitamin K
0.4µg
0%
Trans fat
0.003g
0g
N/A
Saturated fat
0.226g
0.124g
0%
Tryptophan
0.04mg
0.05mg
0%
Threonine
0.083mg
0%
Isoleucine
0.105mg
0.388mg
0%
Leucine
0.2mg
0.525mg
0%
Lysine
0.135mg
0.425mg
0%
Methionine
0.04mg
0.075mg
0%
Phenylalanine
0.13mg
0.35mg
0%
Valine
0.151mg
0.25mg
0%
Histidine
0.057mg
0.263mg
0%
Macronutrient Comparison
Macronutrient breakdown side-by-side comparison
2
2%
12%
84%
Protein:
2.37 g
Fats:
1.36 g
Carbs:
11.67 g
Water:
84.03 g
Other:
0.57 g
3
8%
21%
69%
Protein:
7.81 g
Fats:
0.55 g
Carbs:
20.96 g
Water:
69.23 g
Other:
1.45 g
Contains
more
Fats Fats
+147.3%
Contains
more
Water Water
+21.4%
Contains
more
Protein Protein
+229.5%
Contains
more
Carbs Carbs
+79.6%
Contains
more
Other Other
+154.4%
Fat Type Comparison
Fat type breakdown side-by-side comparison
2
22%
37%
41%
Saturated fat:
Sat. Fat
0.226 g
Monounsaturated fat:
Mono. Fat
0.391 g
Polyunsaturated fat:
Poly. Fat
0.426 g
1
29%
10%
60%
Saturated fat:
Sat. Fat
0.124 g
Monounsaturated fat:
Mono. Fat
0.044 g
Polyunsaturated fat:
Poly. Fat
0.256 g
Contains
more
Mono. Fat Monounsaturated fat
+788.6%
Contains
more
Poly. Fat Polyunsaturated fat
+66.4%
Contains
less
Sat. Fat Saturated fat
-45.1%