Orange Juice vs. Pineapple Juice — Health Impact and Nutrition Comparison


Summary
Although orange and pineapple juices are made from different fruits, they both have various health benefits due to their nutritional composition. Visually, orange juice has a bright orange color, while pineapple juice is commonly light yellow or beige.
Due to the higher level of carbohydrates, pineapple juice has a few more calories.
The predominant vitamin in both orange juice and pineapple juice is vitamin C. Although orange juice contains slightly more amounts of vitamin C, both contain more than enough to fulfill the daily recommended need.
Unlike orange juice, pineapple juice is a great source of manganese, containing 0.504 grams of the mineral. Pineapple juice is also slightly richer in copper, while orange juice is richer in potassium.
Introduction
Both pineapple and orange juices are quite popular around the world. In this article, we will explore their differences by focusing on the nutritional composition.
Overview
Production
Both orange juice and pineapple juice are derived using similar methods, primarily from the freshly squeezed fruits of oranges and pineapples. Alternative techniques can also be employed to extract the juices, such as rehydrating the fruits and subsequently concentrating the resulting liquid.
In commercial settings, various additional processes are implemented to enhance the shelf life of the products, including pasteurization, which can affect the taste, nutrient content, and overall flavor profile.
Moreover, during the production process, both orange juice and pineapple juice often undergo the addition of sugars and vitamin C. The precise amount and type of sugars added may differ depending on the specific brand or product, with some manufacturers incorporating natural sugars inherent in the fruits themselves, while others may introduce additional sweeteners.
The juices are commonly sold in canned and bottled forms.
Taste and Appearance
Orange juice and pineapple juice may seem to have similar colors; however, orange juice tends to have a bright orange color, while pineapple juice is commonly light yellow or beige.
During commercial production, both juices may have flavors added to them to preserve the natural orange and pineapple flavors.
Nutrition
In this article, we will compare the nutritional compositions of raw orange juice and unsweetened pineapple juice (canned or bottled) with added ascorbic acid.
Macronutrients and Calories
Orange and pineapple juice are very similar in macronutrient content. Pineapple juice is only negligibly denser in nutrients consisting of 86% water, while orange juice contains 88% water.
The serving size of both orange and pineapple juice is one cup, which is about 250g. You are most likely to see 8 ounces (240ml) on the nutrition label, which is equivalent to a cup.
In this article, some of the nutritional comparisons are conducted for 100-gram values for better understanding.
Macronutrient Comparison
Contains
more
ProteinProtein
+94.4%
Contains
more
FatsFats
+66.7%
Contains
more
OtherOther
+42.9%
Contains
more
CarbsCarbs
+23.8%
Calories
Due to the higher level of carbohydrates, pineapple juice has a few more calories.
A 100-gram serving of pineapple juice contains 53 calories. The caloric value for the same amount of orange juice is 45.
Subsequently, one cup of orange juice contains 112 calories, while one cup of pineapple juice has 132 calories.
Protein and Fats
These juices are not particularly rich in proteins or fats; however, orange juice is slightly higher in both. Orange and pineapple juice are low in all essential amino acids.
Pineapple juice is relatively richer in polyunsaturated fatty acids, also known as healthy fats.
Carbohydrates
Pineapple juice has a slightly higher content of carbohydrates. A 100-gram serving of pineapple juice contains 13g of carbohydrates, while the same serving of orange juice has 10g.
The carbohydrate content in both of these juices consists of 98% sugar and only 2% fiber.
The predominant sugars found in pineapple juice are glucose, fructose, and sucrose.
Vitamins
During the processing of fruit into juice, it loses a lot of its vitamins. However, orange and pineapple juices still contain a decent amount of vitamins.
Sometimes these juices have additional vitamins added to them during the production process to substitute for the lost ones. For example, the nutritional composition of the pineapple juice discussed in this article is derived from the USDA’s Food Central database, where they clearly state vitamin C has been added to it during production. This might be the case for orange juice as well, although it is not clear because of the lack of information.
The predominant vitamin in both orange juice and pineapple juice is vitamin C. Vitamin C is an antioxidant and plays an important role in the immune system (1).
One cup of orange juice contains 124mg of vitamin C, while the same serving of pineapple juice contains 110mg of vitamin C.
Although orange juice contains slightly more amounts of vitamin C, both contain more than enough to fulfill the daily recommended need. It is recommended to take 90mg of vitamin C for men and 75mg for women daily; however, during the lactation period, the need for women is actually 120mg. Hence, orange juice would be best at fulfilling the daily vitamin C need for lactating women.
Although present in lower quantities, more vitamins are present in both orange juice and pineapple juice. Orange juice contains more vitamin A, as well as most B-group vitamins, such as vitamins B1, B2, B3, B5, and the folate form of vitamin B9. On the other hand, pineapple juice is richer in vitamin B6. Again, keep in mind that these vitamins are present at lower concentrations when put in the context of daily recommended need; hence may even be considered negligible.
Both of these juices completely lack vitamin D and vitamin B12. Again, it is important to note that some manufacturers add more vitamins to the juice to increase the beneficial effects.
Vitamin Comparison
Contains
more
Vitamin CVitamin C
+14.2%
Contains
more
Vitamin AVitamin A
+∞%
Contains
more
Vitamin EVitamin E
+100%
Contains
more
Vitamin B1Vitamin B1
+55.2%
Contains
more
Vitamin B2Vitamin B2
+42.9%
Contains
more
Vitamin B3Vitamin B3
+101%
Contains
more
Vitamin B5Vitamin B5
+239.3%
Contains
more
FolateFolate
+66.7%
Contains
more
Vitamin B6Vitamin B6
+150%
Contains
more
Vitamin KVitamin K
+200%
Minerals
Whereas orange juice was slightly favored in the vitamin category for its vitamin C content, pineapple juice is much more favored in the mineral category.
Specifically, pineapple juice is a great source of manganese, containing 0.504 grams of the mineral.
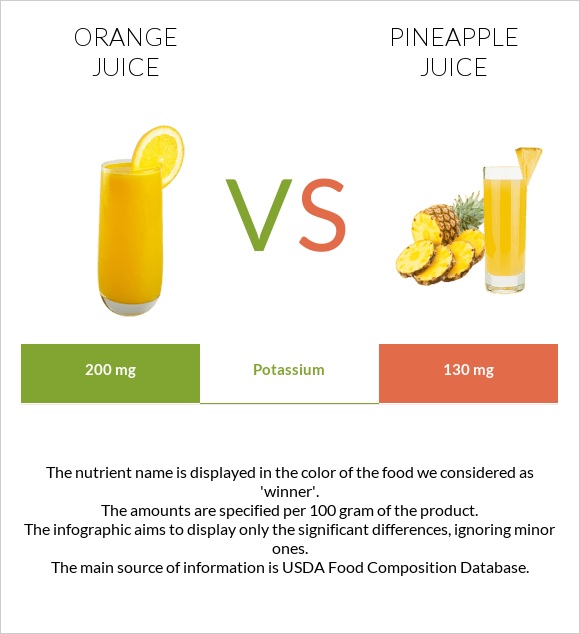
Although present in lower quantities, pineapple juice is also slightly richer in copper, while orange juice is richer in potassium.
Mineral Comparison
Contains
more
PotassiumPotassium
+53.8%
Contains
more
PhosphorusPhosphorus
+112.5%
Contains
less
SodiumSodium
-50%
Contains
more
CalciumCalcium
+18.2%
Contains
more
IronIron
+55%
Contains
more
CopperCopper
+56.8%
Contains
more
ZincZinc
+120%
Contains
more
ManganeseManganese
+3500%
Glycemic Index
The glycemic index of orange or pineapple juice can vary depending on the production method, carbohydrate content, and composition.
Based on numbers from The International Tables of Glycemic Indices, the glycemic index of unsweetened pineapple juice is 46 (2). Another study has found the glycemic index of pineapple juice to be 66 (3).
Based on the mean of three different studies, the glycemic index of orange juice is equal to 59 (2). Harvard Health puts the glycemic index of orange juice in the range of 50±2 (4).
Orange and pineapple juice both fall into the low to moderate glycemic index classification.
One research has demonstrated that raw pineapple juice decreases serum insulin and upregulates glucose transporter expression in rats (5).
A similar study about orange juice concluded that 100% fresh orange juice might decrease insulin response without significantly affecting blood glucose levels (6).
Overall, people with type 2 diabetes can use fresh orange and pineapple juice in moderation without significant adverse effects on health.
Acidity
Orange juice is naturally acidic, with a pH value falling in the range of 3.30 to 4.19 (7).
The acidity of pineapple juice is not dissimilar, with a pH of 3.45 (7).
The acidity of foods can also be measured by a value called the potential renal acid load or PRAL. The PRAL value demonstrates how much base or acid the given food produces inside the body.
The PRAL value for orange and pineapple juice has been calculated to be -3.7 and -2.7, respectively. This demonstrates that orange juice is more alkalizing as compared to pineapple juice.
References
- https://www.mdpi.com/2072-6643/9/11/1211
- https://academic.oup.com/ajcn/article/114/5/1625/6320814
- https://www.researchgate.net/publication/232037162
- Glycemic index for 60+ foods
- https://www.ncbi.nlm.nih.gov/pmc/articles/PMC6170270/
- https://www.ncbi.nlm.nih.gov/pmc/articles/PMC6770506/
- https://www.webpal.org/SAFE/aaarecovery/2_food_storage/Processing/lacf-phs.htm

Infographic
All nutrients comparison - raw data values
| Nutrient | |
|
DV% diff. |
| Manganese | 0.014mg | 0.504mg | 21% |
| Vitamin C | 50mg | 43.8mg | 7% |
| Vitamin B6 | 0.04mg | 0.1mg | 5% |
| Fructose | 3.81g | 5% | |
| Copper | 0.044mg | 0.069mg | 3% |
| Vitamin B1 | 0.09mg | 0.058mg | 3% |
| Vitamin B5 | 0.19mg | 0.056mg | 3% |
| Folate | 30µg | 18µg | 3% |
| Potassium | 200mg | 130mg | 2% |
| Protein | 0.7g | 0.36g | 1% |
| Carbs | 10.4g | 12.87g | 1% |
| Iron | 0.2mg | 0.31mg | 1% |
| Zinc | 0.05mg | 0.11mg | 1% |
| Phosphorus | 17mg | 8mg | 1% |
| Vitamin A | 10µg | 0µg | 1% |
| Vitamin B2 | 0.03mg | 0.021mg | 1% |
| Vitamin B3 | 0.4mg | 0.199mg | 1% |
| Choline | 6.2mg | 3.3mg | 1% |
| Calories | 45kcal | 53kcal | 0% |
| Protein per 100 calories | 1.6g | 0.68g | N/A |
| Calories per 10 g protein | 643kcal | 1472kcal | N/A |
| Weight per 100 calories | 222g | 189g | N/A |
| Fats | 0.2g | 0.12g | 0% |
| Net carbs | 10.2g | 12.67g | N/A |
| Magnesium | 11mg | 12mg | 0% |
| Calcium | 11mg | 13mg | 0% |
| Sugar | 8.4g | 9.98g | N/A |
| Fiber | 0.2g | 0.2g | 0% |
| Sodium | 1mg | 2mg | 0% |
| Vitamin E | 0.04mg | 0.02mg | 0% |
| Selenium | 0.1µg | 0.1µg | 0% |
| Vitamin K | 0.1µg | 0.3µg | 0% |
| Saturated fat | 0.024g | 0.008g | 0% |
| Monounsaturated fat | 0.036g | 0.014g | 0% |
| Polyunsaturated fat | 0.04g | 0.042g | 0% |
| Tryptophan | 0.002mg | 0% | |
| Threonine | 0.008mg | 0% | |
| Isoleucine | 0.008mg | 0% | |
| Leucine | 0.013mg | 0% | |
| Lysine | 0.009mg | 0% | |
| Methionine | 0.003mg | 0% | |
| Phenylalanine | 0.009mg | 0% | |
| Valine | 0.011mg | 0% | |
| Histidine | 0.003mg | 0% |
Fat Type Comparison
| Contains more Mono. FatMonounsaturated fat | +157.1% |
| Contains less Sat. FatSaturated fat | -66.7% |
People also compare


References
All the values for which the sources are not specified explicitly are taken from FDA’s Food Central. The exact link to the food presented on this page can be found below.
- Orange juice - https://fdc.nal.usda.gov/fdc-app.html#/food-details/169098/nutrients
- Pineapple juice - https://fdc.nal.usda.gov/fdc-app.html#/food-details/168187/nutrients
All the Daily Values are presented for males aged 31-50, for 2000-calorie diets.