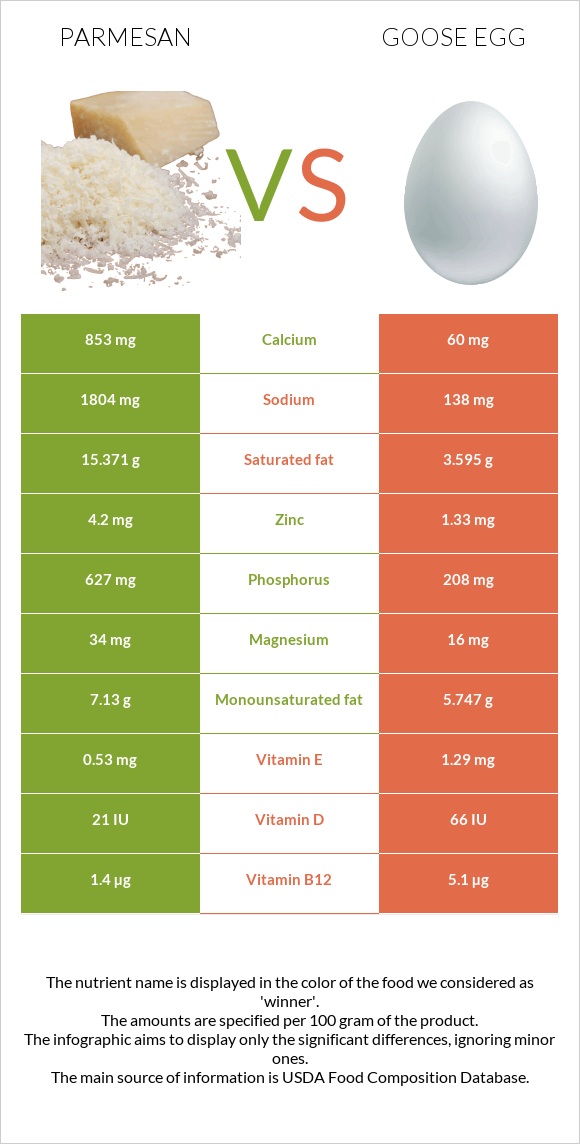
Differences between parmesan and goose eggs Parmesan has more calcium, phosphorus, and zinc, while goose eggs have more vitamin B12, choline, iron, and vitamin B5. Goose eggs' daily need coverage for cholesterol is 255% higher. Goose eggs contain 14 times less calcium than parmesan. Parmesan contains 853mg of calcium, while goose eggs contain 60mg. The amount of sodium in goose eggs is lower. The food types used in this comparison are Cheese, parmesan, grated and Egg, goose, whole, fresh, raw .
Infographic
Mineral Comparison
Mineral comparison score is based on the number of minerals by which one or the other food is richer. The "coverage" charts below show how much of the daily needs can be covered by 300 grams of the food.
5
100 g
300 g
1 tbsp - 5g 1 oz - 28.35g
Magnesium
Magnesium
Calcium
Calcium
Potassium
Potassium
Iron
Iron
Copper
Copper
Zinc
Zinc
Phosphorus
Phosphorus
Sodium
Sodium
Manganese
Manganese
Selenium
Selenium
24%
256%
16%
18%
13%
115%
269%
235%
9.3%
188%
4
100 g
300 g
1 egg - 144g
Magnesium
Magnesium
Calcium
Calcium
Potassium
Potassium
Iron
Iron
Copper
Copper
Zinc
Zinc
Phosphorus
Phosphorus
Sodium
Sodium
Manganese
Manganese
Selenium
Selenium
11%
18%
19%
137%
21%
36%
89%
18%
5%
201%
Vitamin Comparison
Vitamin comparison score is based on the number of vitamins by which one or the other food is richer. The "coverage" charts below show how much of the daily needs can be covered by 300 grams of the food.
2
100 g
300 g
1 tbsp - 5g 1 oz - 28.35g
Vitamin C
Vit. C
Vitamin D
Vit. D
Vitamin A
Vit. A
Vitamin E
Vit. E
Vitamin B1
Vit. B1
Vitamin B2
Vit. B2
Vitamin B3
Vit. B3
Vitamin B5
Vit. B5
Vitamin B6
Vit. B6
Vitamin B12
Vit. B12
Vitamin K
Vit. K
Folate
Folate
0%
7.5%
87%
11%
6.5%
83%
1.5%
27%
19%
175%
4.3%
4.5%
8
100 g
300 g
1 egg - 144g
Vitamin C
Vit. C
Vitamin D
Vit. D
Vitamin A
Vit. A
Vitamin E
Vit. E
Vitamin B1
Vit. B1
Vitamin B2
Vit. B2
Vitamin B3
Vit. B3
Vitamin B5
Vit. B5
Vitamin B6
Vit. B6
Vitamin B12
Vit. B12
Vitamin K
Vit. K
Folate
Folate
0%
26%
62%
26%
37%
88%
3.5%
106%
54%
638%
1%
57%
All nutrients comparison - raw data values
Nutrient
DV% diff.
Cholesterol
86mg
852mg
255%
Vitamin B12
1.4µg
5.1µg
154%
Calcium
853mg
60mg
79%
Sodium
1804mg
138mg
72%
Phosphorus
627mg
208mg
60%
Saturated fat
15.371g
3.595g
54%
Choline
14.1mg
263.4mg
45%
Iron
0.49mg
3.64mg
39%
Protein
28.42g
13.87g
29%
Zinc
4.2mg
1.33mg
26%
Vitamin B5
0.45mg
1.759mg
26%
Fats
27.84g
13.27g
22%
Folate
6µg
76µg
18%
Calories
420kcal
185kcal
12%
Vitamin B6
0.081mg
0.236mg
12%
Vitamin B1
0.026mg
0.147mg
10%
Vitamin A
262µg
187µg
8%
Vitamin D*
21 IU
66 IU
6%
Vitamin D
0.5µg
1.7µg
6%
Vitamin E
0.53mg
1.29mg
5%
Selenium
34.4µg
36.9µg
5%
Carbs
13.91g
1.35g
4%
Magnesium
34mg
16mg
4%
Monounsaturated fat
7.13g
5.747g
3%
Copper
0.04mg
0.062mg
2%
Vitamin B2
0.358mg
0.382mg
2%
Polyunsaturated fat
1.386g
1.672g
2%
Potassium
180mg
210mg
1%
Manganese
0.071mg
0.038mg
1%
Vitamin B3
0.08mg
0.189mg
1%
Vitamin K
1.7µg
0.4µg
1%
Protein per 100 calories
6.8g
7.5g
N/A
Calories per 10 g protein
148kcal
133kcal
N/A
Weight per 100 calories
24g
54g
N/A
Unsaturated / Saturated Fat ratio
0.55
2.1
N/A
Net carbs
13.91g
1.35g
N/A
Sugar
0.07g
0.94g
N/A
Trans fat
0.876g
N/A
Tryptophan
0.383mg
0.282mg
0%
Threonine
1.075mg
0.797mg
0%
Isoleucine
1.455mg
0.647mg
0%
Leucine
2.747mg
1.188mg
0%
Lysine
2.201mg
1.03mg
0%
Methionine
0.751mg
0.624mg
0%
Phenylalanine
1.538mg
0.91mg
0%
Valine
1.865mg
0.958mg
0%
Histidine
0.806mg
0.346mg
0%
Omega-3 - ALA
0.102g
N/A
Omega-3 - DPA
0.015g
0g
N/A
Omega-3 - Eicosatrienoic acid
0.002g
N/A
Omega-6 - Gamma-linoleic acid
0.002g
N/A
Omega-6 - Dihomo-gamma-linoleic acid
0.026g
N/A
Omega-6 - Eicosadienoic acid
0.006g
N/A
Omega-6 - Linoleic acid
0.87g
N/A
Macronutrient Comparison
Macronutrient breakdown side-by-side comparison
4
28%
28%
14%
23%
7%
Protein:
28.42 g
Fats:
27.84 g
Carbs:
13.91 g
Water:
22.65 g
Other:
7.18 g
1
14%
13%
70%
Protein:
13.87 g
Fats:
13.27 g
Carbs:
1.35 g
Water:
70.43 g
Other:
1.08 g
Contains
more
Protein Protein
+104.9%
Contains
more
Fats Fats
+109.8%
Contains
more
Carbs Carbs
+930.4%
Contains
more
Other Other
+564.8%
Contains
more
Water Water
+210.9%
Fat Type Comparison
Fat type breakdown side-by-side comparison
1
64%
30%
6%
Saturated fat:
Sat. Fat
15.371 g
Monounsaturated fat:
Mono. Fat
7.13 g
Polyunsaturated fat:
Poly. Fat
1.386 g
2
33%
52%
15%
Saturated fat:
Sat. Fat
3.595 g
Monounsaturated fat:
Mono. Fat
5.747 g
Polyunsaturated fat:
Poly. Fat
1.672 g
Contains
more
Mono. Fat Monounsaturated fat
+24.1%
Contains
less
Sat. Fat Saturated fat
-76.6%
Contains
more
Poly. Fat Polyunsaturated fat
+20.6%