Significant differences between patty and focaccia Patty has more vitamin B12 and zinc; however, focaccia is richer in vitamin B1, folate, iron, manganese, and vitamin B2. Patty covers your daily vitamin B12 needs 85% more than focaccia. Focaccia has a higher glycemic index. The glycemic index of focaccia is 63, while the glycemic index of patty is 0. Specific food types used in this comparison are USDA Commodity, beef, patties (100%), frozen, raw and Focaccia, Italian flatbread, plain .
Infographic
Mineral Comparison
Mineral comparison score is based on the number of minerals by which one or the other food is richer. The "coverage" charts below show how much of the daily needs can be covered by 300 grams of the food.
4
100 g
300 g
3 oz - 85g
Magnesium
Magnesium
Calcium
Calcium
Potassium
Potassium
Iron
Iron
Copper
Copper
Zinc
Zinc
Phosphorus
Phosphorus
Sodium
Sodium
Manganese
Manganese
Selenium
Selenium
13%
2.1%
24%
72%
24%
112%
62%
9.7%
2.2%
81%
5
100 g
300 g
1 piece - 57g
Magnesium
Magnesium
Calcium
Calcium
Potassium
Potassium
Iron
Iron
Copper
Copper
Zinc
Zinc
Phosphorus
Phosphorus
Sodium
Sodium
Manganese
Manganese
Selenium
Selenium
14%
11%
10%
119%
30%
36%
55%
73%
47%
87%
Vitamin Comparison
Vitamin comparison score is based on the number of vitamins by which one or the other food is richer. The "coverage" charts below show how much of the daily needs can be covered by 300 grams of the food.
2
100 g
300 g
3 oz - 85g
Vitamin C
Vit. C
Vitamin D
Vit. D
Vitamin A
Vit. A
Vitamin E
Vit. E
Vitamin B1
Vit. B1
Vitamin B2
Vit. B2
Vitamin B3
Vit. B3
Vitamin B5
Vit. B5
Vitamin B6
Vit. B6
Vitamin B12
Vit. B12
Vitamin K
Vit. K
Folate
Folate
0%
0%
0%
0%
11%
37%
72%
19%
49%
256%
0%
4.5%
6
100 g
300 g
1 piece - 57g
Vitamin C
Vit. C
Vitamin D
Vit. D
Vitamin A
Vit. A
Vitamin E
Vit. E
Vitamin B1
Vit. B1
Vitamin B2
Vit. B2
Vitamin B3
Vit. B3
Vitamin B5
Vit. B5
Vitamin B6
Vit. B6
Vitamin B12
Vit. B12
Vitamin K
Vit. K
Folate
Folate
0%
0%
0%
28%
118%
69%
69%
39%
26%
0%
14%
104%
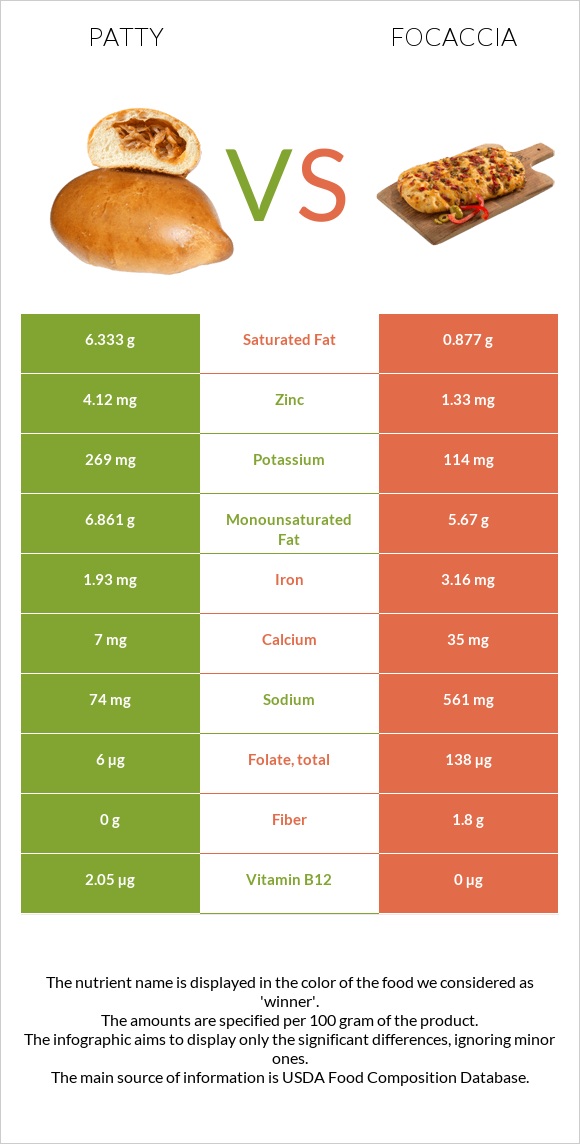
All nutrients comparison - raw data values
Nutrient
DV% diff.
Vitamin B12
2.05µg
0µg
85%
Vitamin B1
0.043mg
0.47mg
36%
Folate
6µg
138µg
33%
Zinc
4.12mg
1.33mg
25%
Saturated fat
6.333g
0.877g
25%
Sodium
74mg
561mg
21%
Cholesterol
53mg
0mg
18%
Iron
1.93mg
3.16mg
15%
Manganese
0.017mg
0.364mg
15%
Protein
14.63g
8.77g
12%
Fats
15.69g
7.89g
12%
Carbs
0g
35.82g
12%
Vitamin B2
0.16mg
0.301mg
11%
Vitamin E
1.42mg
9%
Vitamin B6
0.214mg
0.113mg
8%
Fiber
0g
1.8g
7%
Vitamin B5
0.309mg
0.645mg
7%
Potassium
269mg
114mg
5%
Vitamin K
5.7µg
5%
Calcium
7mg
35mg
3%
Monounsaturated fat
6.861g
5.67g
3%
Calories
204kcal
249kcal
2%
Copper
0.073mg
0.091mg
2%
Phosphorus
145mg
128mg
2%
Selenium
14.8µg
15.9µg
2%
Polyunsaturated fat
0.643g
0.994g
2%
Vitamin B3
3.846mg
3.67mg
1%
Choline
2.9mg
1%
Protein per 100 calories
7.2g
3.5g
N/A
Calories per 10 g protein
139kcal
284kcal
N/A
Weight per 100 calories
49g
40g
N/A
Unsaturated / Saturated Fat ratio
1.2
7.6
N/A
Net carbs
0g
34.02g
N/A
Magnesium
18mg
20mg
0%
Sugar
1.75g
N/A
Macronutrient Comparison
Macronutrient breakdown side-by-side comparison
4
15%
16%
65%
5%
Protein:
14.63 g
Fats:
15.69 g
Carbs:
0 g
Water:
64.72 g
Other:
4.96 g
1
9%
8%
36%
46%
Protein:
8.77 g
Fats:
7.89 g
Carbs:
35.82 g
Water:
45.91 g
Other:
1.61 g
Contains
more
Protein Protein
+66.8%
Contains
more
Fats Fats
+98.9%
Contains
more
Water Water
+41%
Contains
more
Other Other
+208.1%
Contains
more
Carbs Carbs
+∞%
Fat Type Comparison
Fat type breakdown side-by-side comparison
1
46%
50%
5%
Saturated fat:
Sat. Fat
6.333 g
Monounsaturated fat:
Mono. Fat
6.861 g
Polyunsaturated fat:
Poly. Fat
0.643 g
2
12%
75%
13%
Saturated fat:
Sat. Fat
0.877 g
Monounsaturated fat:
Mono. Fat
5.67 g
Polyunsaturated fat:
Poly. Fat
0.994 g
Contains
more
Mono. Fat Monounsaturated fat
+21%
Contains
less
Sat. Fat Saturated fat
-86.2%
Contains
more
Poly. Fat Polyunsaturated fat
+54.6%