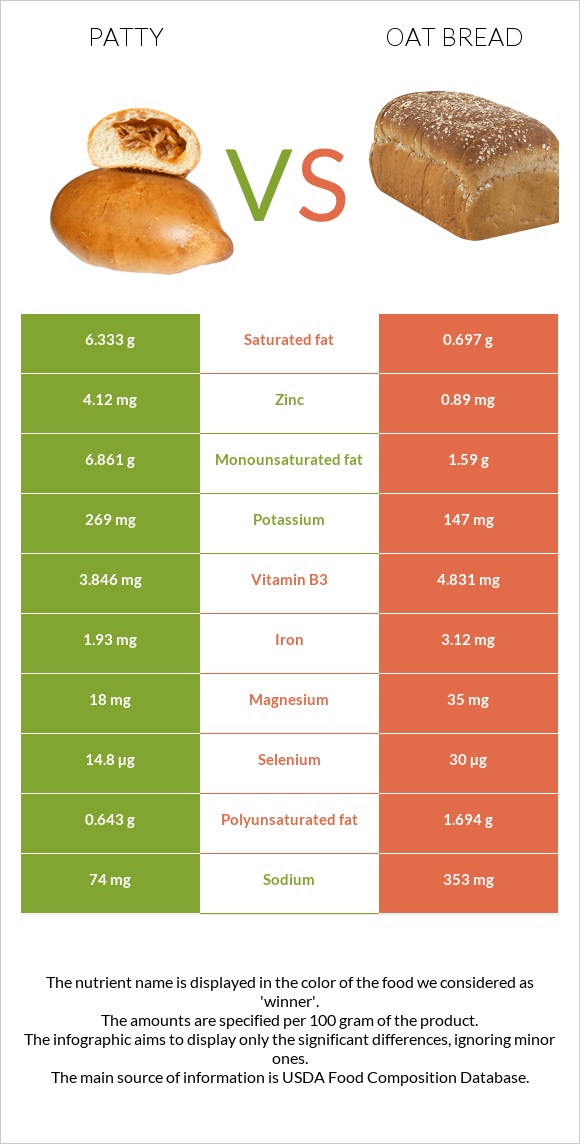
The main differences between patty and oat bread Patty is richer in vitamin B12 and zinc, yet oat bread is richer in vitamin B1, manganese, selenium, folate, fiber, and iron. Daily need coverage for vitamin B12 for patty is 85% higher. Patty has a lower glycemic index than oat bread. Food types used in this article are USDA Commodity, beef, patties (100%), frozen, raw and Bread, oat bran .
Infographic
Mineral Comparison
Mineral comparison score is based on the number of minerals by which one or the other food is richer. The "coverage" charts below show how much of the daily needs can be covered by 300 grams of the food.
3
100 g
300 g
3 oz - 85g
Magnesium
Magnesium
Calcium
Calcium
Potassium
Potassium
Iron
Iron
Copper
Copper
Zinc
Zinc
Phosphorus
Phosphorus
Sodium
Sodium
Manganese
Manganese
Selenium
Selenium
13%
2.1%
24%
72%
24%
112%
62%
9.7%
2.2%
81%
6
100 g
300 g
1 oz - 28.35g 1 slice - 30g
Magnesium
Magnesium
Calcium
Calcium
Potassium
Potassium
Iron
Iron
Copper
Copper
Zinc
Zinc
Phosphorus
Phosphorus
Sodium
Sodium
Manganese
Manganese
Selenium
Selenium
25%
20%
13%
117%
45%
24%
60%
46%
102%
164%
Vitamin Comparison
Vitamin comparison score is based on the number of vitamins by which one or the other food is richer. The "coverage" charts below show how much of the daily needs can be covered by 300 grams of the food.
2
100 g
300 g
3 oz - 85g
Vitamin C
Vit. C
Vitamin D
Vit. D
Vitamin A
Vit. A
Vitamin E
Vit. E
Vitamin B1
Vit. B1
Vitamin B2
Vit. B2
Vitamin B3
Vit. B3
Vitamin B5
Vit. B5
Vitamin B6
Vit. B6
Vitamin B12
Vit. B12
Vitamin K
Vit. K
Folate
Folate
0%
0%
0%
0%
11%
37%
72%
19%
49%
256%
0%
4.5%
8
100 g
300 g
1 oz - 28.35g 1 slice - 30g
Vitamin C
Vit. C
Vitamin D
Vit. D
Vitamin A
Vit. A
Vitamin E
Vit. E
Vitamin B1
Vit. B1
Vitamin B2
Vit. B2
Vitamin B3
Vit. B3
Vitamin B5
Vit. B5
Vitamin B6
Vit. B6
Vitamin B12
Vit. B12
Vitamin K
Vit. K
Folate
Folate
0%
0%
0.67%
8.8%
126%
80%
91%
35%
17%
0%
3%
61%
All nutrients comparison - raw data values
Nutrient
DV% diff.
Vitamin B12
2.05µg
0µg
85%
Vitamin B1
0.043mg
0.504mg
38%
Manganese
0.017mg
0.779mg
33%
Zinc
4.12mg
0.89mg
29%
Selenium
14.8µg
30µg
28%
Saturated fat
6.333g
0.697g
26%
Folate
6µg
81µg
19%
Cholesterol
53mg
0mg
18%
Fiber
0g
4.5g
18%
Fats
15.69g
4.4g
17%
Iron
1.93mg
3.12mg
15%
Vitamin B2
0.16mg
0.346mg
14%
Carbs
0g
39.8g
13%
Monounsaturated fat
6.861g
1.59g
13%
Sodium
74mg
353mg
12%
Vitamin B6
0.214mg
0.073mg
11%
Protein
14.63g
10.4g
8%
Copper
0.073mg
0.135mg
7%
Polyunsaturated fat
0.643g
1.694g
7%
Calcium
7mg
65mg
6%
Vitamin B3
3.846mg
4.831mg
6%
Vitamin B5
0.309mg
0.581mg
5%
Magnesium
18mg
35mg
4%
Potassium
269mg
147mg
4%
Vitamin E
0.44mg
3%
Choline
18.7mg
3%
Calories
204kcal
236kcal
2%
Phosphorus
145mg
141mg
1%
Vitamin K
1.2µg
1%
Protein per 100 calories
7.2g
4.4g
N/A
Calories per 10 g protein
139kcal
227kcal
N/A
Weight per 100 calories
49g
42g
N/A
Unsaturated / Saturated Fat ratio
1.2
4.7
N/A
Net carbs
0g
35.3g
N/A
Sugar
7.7g
N/A
Vitamin A
0µg
2µg
0%
Tryptophan
0.131mg
0%
Threonine
0.299mg
0%
Isoleucine
0.399mg
0%
Leucine
0.733mg
0%
Lysine
0.297mg
0%
Methionine
0.179mg
0%
Phenylalanine
0.518mg
0%
Valine
0.461mg
0%
Histidine
0.225mg
0%
Macronutrient Comparison
Macronutrient breakdown side-by-side comparison
4
15%
16%
65%
5%
Protein:
14.63 g
Fats:
15.69 g
Carbs:
0 g
Water:
64.72 g
Other:
4.96 g
1
10%
4%
40%
44%
Protein:
10.4 g
Fats:
4.4 g
Carbs:
39.8 g
Water:
44 g
Other:
1.4 g
Contains
more
Protein Protein
+40.7%
Contains
more
Fats Fats
+256.6%
Contains
more
Water Water
+47.1%
Contains
more
Other Other
+254.3%
Contains
more
Carbs Carbs
+∞%
Fat Type Comparison
Fat type breakdown side-by-side comparison
1
46%
50%
5%
Saturated fat:
Sat. Fat
6.333 g
Monounsaturated fat:
Mono. Fat
6.861 g
Polyunsaturated fat:
Poly. Fat
0.643 g
2
18%
40%
43%
Saturated fat:
Sat. Fat
0.697 g
Monounsaturated fat:
Mono. Fat
1.59 g
Polyunsaturated fat:
Poly. Fat
1.694 g
Contains
more
Mono. Fat Monounsaturated fat
+331.5%
Contains
less
Sat. Fat Saturated fat
-89%
Contains
more
Poly. Fat Polyunsaturated fat
+163.5%