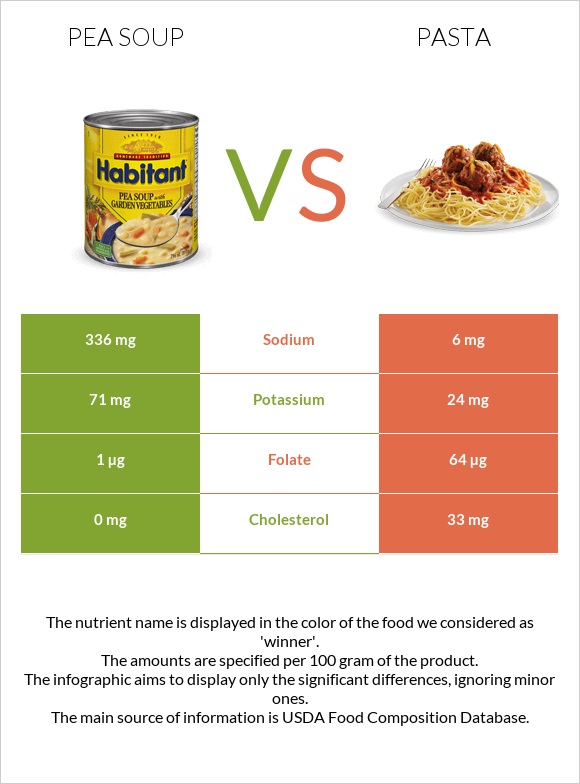
Summary of differences between pea soup and pasta Pea soup has more copper; however, pasta is higher in folate, vitamin B1, vitamin B2, vitamin B12, and iron. Pasta covers your daily need for folate, 16% more than pea soup. Pea soup has 56 times more sodium than pasta. While pea soup has 336mg of sodium, pasta has only 6mg. The glycemic index of pea soup is higher. These are the specific foods used in this comparison Soup, pea, green, canned, prepared with equal volume water and Pasta, fresh-refrigerated, plain, cooked .
Infographic
Mineral Comparison
Mineral comparison score is based on the number of minerals by which one or the other food is richer. The "coverage" charts below show how much of the daily needs can be covered by 300 grams of the food.
5
100 g
300 g
1 fl oz - 32.4g 1 serving 1 cup - 259g
Magnesium
Magnesium
Calcium
Calcium
Potassium
Potassium
Iron
Iron
Copper
Copper
Zinc
Zinc
Phosphorus
Phosphorus
Sodium
Sodium
Manganese
Manganese
Selenium
Selenium
11%
3.6%
6.3%
27%
49%
17%
20%
44%
32%
20%
4
100 g
300 g
2 oz - 128g
Magnesium
Magnesium
Calcium
Calcium
Potassium
Potassium
Iron
Iron
Copper
Copper
Zinc
Zinc
Phosphorus
Phosphorus
Sodium
Sodium
Manganese
Manganese
Selenium
Selenium
13%
1.8%
2.1%
43%
31%
15%
27%
0.78%
29%
0%
Vitamin Comparison
Vitamin comparison score is based on the number of vitamins by which one or the other food is richer. The "coverage" charts below show how much of the daily needs can be covered by 300 grams of the food.
3
100 g
300 g
1 fl oz - 32.4g 1 serving 1 cup - 259g
Vitamin C
Vit. C
Vitamin D
Vit. D
Vitamin A
Vit. A
Vitamin E
Vit. E
Vitamin B1
Vit. B1
Vitamin B2
Vit. B2
Vitamin B3
Vit. B3
Vitamin B5
Vit. B5
Vitamin B6
Vit. B6
Vitamin B12
Vit. B12
Vitamin K
Vit. K
Folate
Folate
2%
0%
1%
1.8%
10%
5.8%
8.7%
2.9%
4.6%
0%
0.5%
0.75%
8
100 g
300 g
2 oz - 128g
Vitamin C
Vit. C
Vitamin D
Vit. D
Vitamin A
Vit. A
Vitamin E
Vit. E
Vitamin B1
Vit. B1
Vitamin B2
Vit. B2
Vitamin B3
Vit. B3
Vitamin B5
Vit. B5
Vitamin B6
Vit. B6
Vitamin B12
Vit. B12
Vitamin K
Vit. K
Folate
Folate
0%
0%
2%
0%
52%
35%
19%
11%
7.8%
18%
0%
48%
All nutrients comparison - raw data values
Nutrient
DV% diff.
Folate
1µg
64µg
16%
Sodium
336mg
6mg
14%
Vitamin B1
0.04mg
0.209mg
14%
Cholesterol
0mg
33mg
11%
Vitamin B2
0.025mg
0.15mg
10%
Fiber
1.9g
8%
Selenium
3.6µg
7%
Copper
0.146mg
0.093mg
6%
Vitamin B12
0µg
0.14µg
6%
Carbs
9.88g
24.93g
5%
Iron
0.73mg
1.14mg
5%
Calories
61kcal
131kcal
4%
Protein
3.2g
5.15g
4%
Vitamin B3
0.462mg
0.992mg
3%
Vitamin B5
0.049mg
0.183mg
3%
Phosphorus
47mg
63mg
2%
Choline
13.2mg
2%
Saturated fat
0.524g
0.15g
2%
Polyunsaturated fat
0.142g
0.429g
2%
Vitamin C
0.6mg
0mg
1%
Magnesium
15mg
18mg
1%
Calcium
12mg
6mg
1%
Potassium
71mg
24mg
1%
Zinc
0.64mg
0.56mg
1%
Vitamin E
0.09mg
1%
Manganese
0.245mg
0.224mg
1%
Vitamin B6
0.02mg
0.034mg
1%
Monounsaturated fat
0.372g
0.124g
1%
Protein per 100 calories
5.2g
3.9g
N/A
Calories per 10 g protein
191kcal
254kcal
N/A
Weight per 100 calories
164g
76g
N/A
Fats
1.09g
1.05g
0%
Net carbs
7.98g
24.93g
N/A
Sugar
3.19g
N/A
Vitamin A
3µg
6µg
0%
Vitamin K
0.2µg
0%
Tryptophan
0.065mg
0%
Threonine
0.134mg
0%
Isoleucine
0.197mg
0%
Leucine
0.348mg
0%
Lysine
0.097mg
0%
Methionine
0.079mg
0%
Phenylalanine
0.247mg
0%
Valine
0.217mg
0%
Histidine
0.103mg
0%
Macronutrient Comparison
Macronutrient breakdown side-by-side comparison
3
3%
10%
85%
Protein:
3.2 g
Fats:
1.09 g
Carbs:
9.88 g
Water:
84.55 g
Other:
1.28 g
2
5%
25%
69%
Protein:
5.15 g
Fats:
1.05 g
Carbs:
24.93 g
Water:
68.56 g
Other:
0.31 g
Contains
more
Water Water
+23.3%
Contains
more
Other Other
+312.9%
Contains
more
Protein Protein
+60.9%
Contains
more
Carbs Carbs
+152.3%
Fat Type Comparison
Fat type breakdown side-by-side comparison
1
50%
36%
14%
Saturated fat:
Sat. Fat
0.524 g
Monounsaturated fat:
Mono. Fat
0.372 g
Polyunsaturated fat:
Poly. Fat
0.142 g
2
21%
18%
61%
Saturated fat:
Sat. Fat
0.15 g
Monounsaturated fat:
Mono. Fat
0.124 g
Polyunsaturated fat:
Poly. Fat
0.429 g
Contains
more
Mono. Fat Monounsaturated fat
+200%
Contains
less
Sat. Fat Saturated fat
-71.4%
Contains
more
Poly. Fat Polyunsaturated fat
+202.1%