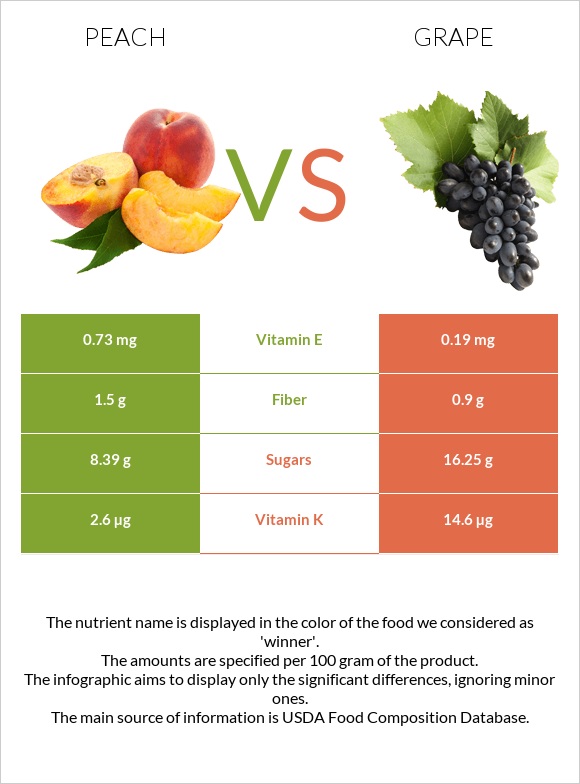
What are the differences between peach and grapes? Grapes are richer than peach in manganese, vitamin K, vitamin B6, and vitamin B1. Grapes' daily need coverage for manganese is 29% more. Peach has 4 times more vitamin E than grapes. While peach has 0.73mg of vitamin E, grapes have only 0.19mg. The amount of sugar in peach is lower. We used Peaches, yellow, raw and Grapes, american type (slip skin), raw types in this article.
Infographic
Mineral Comparison
Mineral comparison score is based on the number of minerals by which one or the other food is richer. The "coverage" charts below show how much of the daily needs can be covered by 300 grams of the food.
5
100 g
300 g
1 small (2-1/2" dia) - 130g 1 NLEA serving - 147g 1 medium (2-2/3" dia) - 150g 1 cup slices - 154g 1 large (2-3/4" dia) - 175g 1 extra large (3" dia) - 224g
Magnesium
Magnesium
Calcium
Calcium
Potassium
Potassium
Iron
Iron
Copper
Copper
Zinc
Zinc
Phosphorus
Phosphorus
Sodium
Sodium
Manganese
Manganese
Selenium
Selenium
6.4%
1.8%
17%
9.4%
23%
4.6%
8.6%
0%
8%
0.55%
3
100 g
300 g
1 grape - 2.4g 1 cup - 92g
Magnesium
Magnesium
Calcium
Calcium
Potassium
Potassium
Iron
Iron
Copper
Copper
Zinc
Zinc
Phosphorus
Phosphorus
Sodium
Sodium
Manganese
Manganese
Selenium
Selenium
3.6%
4.2%
17%
11%
13%
1.1%
4.3%
0.26%
94%
0.55%
Vitamin Comparison
Vitamin comparison score is based on the number of vitamins by which one or the other food is richer. The "coverage" charts below show how much of the daily needs can be covered by 300 grams of the food.
5
100 g
300 g
1 small (2-1/2" dia) - 130g 1 NLEA serving - 147g 1 medium (2-2/3" dia) - 150g 1 cup slices - 154g 1 large (2-3/4" dia) - 175g 1 extra large (3" dia) - 224g
Vitamin C
Vit. C
Vitamin D
Vit. D
Vitamin A
Vit. A
Vitamin E
Vit. E
Vitamin B1
Vit. B1
Vitamin B2
Vit. B2
Vitamin B3
Vit. B3
Vitamin B5
Vit. B5
Vitamin B6
Vit. B6
Vitamin B12
Vit. B12
Vitamin K
Vit. K
Folate
Folate
22%
0%
5.3%
15%
6%
7.2%
15%
9.2%
5.8%
0%
6.5%
3%
4
100 g
300 g
1 grape - 2.4g 1 cup - 92g
Vitamin C
Vit. C
Vitamin D
Vit. D
Vitamin A
Vit. A
Vitamin E
Vit. E
Vitamin B1
Vit. B1
Vitamin B2
Vit. B2
Vitamin B3
Vit. B3
Vitamin B5
Vit. B5
Vitamin B6
Vit. B6
Vitamin B12
Vit. B12
Vitamin K
Vit. K
Folate
Folate
13%
0%
1.7%
3.8%
23%
13%
5.6%
1.4%
25%
0%
37%
3%
All nutrients comparison - raw data values
Nutrient
DV% diff.
Manganese
0.061mg
0.718mg
29%
Vitamin K
2.6µg
14.6µg
10%
Vitamin B6
0.025mg
0.11mg
7%
Vitamin B1
0.024mg
0.092mg
6%
Vitamin E
0.73mg
0.19mg
4%
Vitamin C
6.6mg
4mg
3%
Carbs
9.54g
17.15g
3%
Copper
0.068mg
0.04mg
3%
Vitamin B3
0.806mg
0.3mg
3%
Vitamin B5
0.153mg
0.024mg
3%
Fiber
1.5g
0.9g
2%
Vitamin B2
0.031mg
0.057mg
2%
Fructose
1.53g
2%
Calories
39kcal
67kcal
1%
Protein
0.91g
0.63g
1%
Magnesium
9mg
5mg
1%
Calcium
6mg
14mg
1%
Zinc
0.17mg
0.04mg
1%
Phosphorus
20mg
10mg
1%
Vitamin A
16µg
5µg
1%
Protein per 100 calories
2.3g
0.94g
N/A
Calories per 10 g protein
429kcal
1063kcal
N/A
Weight per 100 calories
256g
149g
N/A
Fats
0.25g
0.35g
0%
Net carbs
8.04g
16.25g
N/A
Potassium
190mg
191mg
0%
Iron
0.25mg
0.29mg
0%
Sugar
8.39g
16.25g
N/A
Sodium
0mg
2mg
0%
Selenium
0.1µg
0.1µg
0%
Folate
4µg
4µg
0%
Choline
6.1mg
5.6mg
0%
Saturated fat
0.019g
0.114g
0%
Monounsaturated fat
0.067g
0.014g
0%
Polyunsaturated fat
0.086g
0.102g
0%
Tryptophan
0.01mg
0.003mg
0%
Threonine
0.016mg
0.017mg
0%
Isoleucine
0.017mg
0.005mg
0%
Leucine
0.027mg
0.013mg
0%
Lysine
0.03mg
0.014mg
0%
Methionine
0.01mg
0.021mg
0%
Phenylalanine
0.019mg
0.013mg
0%
Valine
0.022mg
0.017mg
0%
Histidine
0.013mg
0.023mg
0%
Macronutrient Comparison
Macronutrient breakdown side-by-side comparison
2
10%
89%
Protein:
0.91 g
Fats:
0.25 g
Carbs:
9.54 g
Water:
88.87 g
Other:
0.43 g
3
17%
81%
Protein:
0.63 g
Fats:
0.35 g
Carbs:
17.15 g
Water:
81.3 g
Other:
0.57 g
Contains
more
Protein Protein
+44.4%
Contains
more
Fats Fats
+40%
Contains
more
Carbs Carbs
+79.8%
Contains
more
Other Other
+32.6%
Fat Type Comparison
Fat type breakdown side-by-side comparison
2
11%
39%
50%
Saturated fat:
Sat. Fat
0.019 g
Monounsaturated fat:
Mono. Fat
0.067 g
Polyunsaturated fat:
Poly. Fat
0.086 g
1
50%
6%
44%
Saturated fat:
Sat. Fat
0.114 g
Monounsaturated fat:
Mono. Fat
0.014 g
Polyunsaturated fat:
Poly. Fat
0.102 g
Contains
less
Sat. Fat Saturated fat
-83.3%
Contains
more
Mono. Fat Monounsaturated fat
+378.6%
Contains
more
Poly. Fat Polyunsaturated fat
+18.6%