Pecan pie vs. True morels — In-Depth Nutrition Comparison
Compare
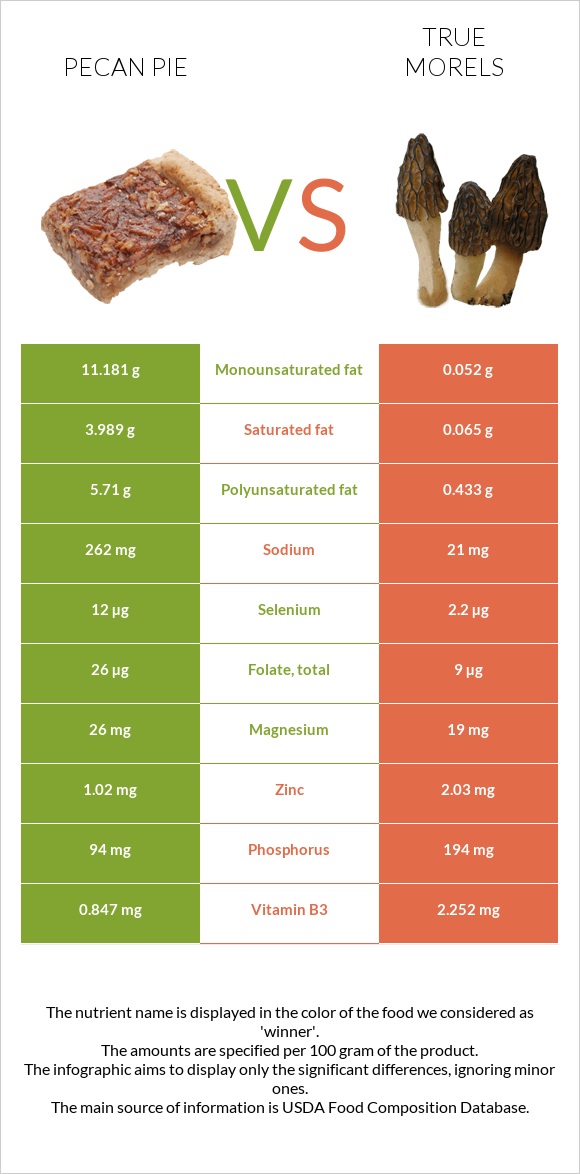
A recap on the differences between pecan pie and true morels
- Pecan pie has more selenium and vitamin B1; however, true morels are higher in iron, copper, phosphorus, zinc, vitamin B3, and potassium.
- True morels cover your daily iron needs 134% more than pecan pie.
- True morels contain 61 times less saturated fat than pecan pie. Pecan pie contains 3.989g of saturated fat, while true morels contain 0.065g.
- The glycemic index of pecan pie is higher.
Food varieties used in this article are Pie, pecan, prepared from recipe and Mushrooms, morel, raw.
Infographic
Infographic link
Mineral Comparison
Mineral comparison score is based on the number of minerals by which one or the other food is richer. The "coverage" charts below show how much of the daily needs can be covered by 300 grams of the food.
| Contains more MagnesiumMagnesium | +36.8% |
| Contains more ManganeseManganese | +21.3% |
| Contains more SeleniumSelenium | +445.5% |
| Contains more CalciumCalcium | +34.4% |
| Contains more PotassiumPotassium | +209% |
| Contains more IronIron | +723% |
| Contains more CopperCopper | +196.2% |
| Contains more ZincZinc | +99% |
| Contains more PhosphorusPhosphorus | +106.4% |
| Contains less SodiumSodium | -92% |
Vitamin Comparison
Vitamin comparison score is based on the number of vitamins by which one or the other food is richer. The "coverage" charts below show how much of the daily needs can be covered by 300 grams of the food.
| Contains more Vitamin CVitamin C | +∞% |
| Contains more Vitamin AVitamin A | +∞% |
| Contains more Vitamin B1Vitamin B1 | +172.5% |
| Contains more Vitamin B12Vitamin B12 | +∞% |
| Contains more FolateFolate | +188.9% |
| Contains more Vitamin B2Vitamin B2 | +13.9% |
| Contains more Vitamin B3Vitamin B3 | +165.9% |
| Contains more Vitamin B6Vitamin B6 | +126.7% |
All nutrients comparison - raw data values
| Nutrient |  |
 |
DV% diff. |
| Iron | 1.48mg | 12.18mg | 134% |
| Copper | 0.211mg | 0.625mg | 46% |
| Polyunsaturated fat | 5.71g | 0.433g | 35% |
| Fats | 22.2g | 0.57g | 33% |
| Cholesterol | 87mg | 29% | |
| Monounsaturated fat | 11.181g | 0.052g | 28% |
| Vitamin D | 206 IU | 26% | |
| Vitamin D | 5.1µg | 26% | |
| Calories | 412kcal | 31kcal | 19% |
| Selenium | 12µg | 2.2µg | 18% |
| Saturated fat | 3.989g | 0.065g | 18% |
| Carbs | 52.2g | 5.1g | 16% |
| Phosphorus | 94mg | 194mg | 14% |
| Fiber | 2.8g | 11% | |
| Sodium | 262mg | 21mg | 10% |
| Vitamin B1 | 0.188mg | 0.069mg | 10% |
| Zinc | 1.02mg | 2.03mg | 9% |
| Vitamin A | 82µg | 0µg | 9% |
| Vitamin B3 | 0.847mg | 2.252mg | 9% |
| Potassium | 133mg | 411mg | 8% |
| Vitamin B12 | 0.17µg | 7% | |
| Vitamin B6 | 0.06mg | 0.136mg | 6% |
| Manganese | 0.712mg | 0.587mg | 5% |
| Protein | 4.9g | 3.12g | 4% |
| Folate | 26µg | 9µg | 4% |
| Magnesium | 26mg | 19mg | 2% |
| Vitamin B2 | 0.18mg | 0.205mg | 2% |
| Calcium | 32mg | 43mg | 1% |
| Vitamin B5 | 0.479mg | 0.44mg | 1% |
| Vitamin C | 0.2mg | 0% | |
| Net carbs | 52.2g | 2.3g | N/A |
| Sugar | 0.6g | N/A | |
| Tryptophan | 0.069mg | 0% | |
| Threonine | 0.189mg | 0% | |
| Isoleucine | 0.223mg | 0% | |
| Leucine | 0.372mg | 0% | |
| Lysine | 0.248mg | 0% | |
| Methionine | 0.125mg | 0% | |
| Phenylalanine | 0.25mg | 0% | |
| Valine | 0.255mg | 0% | |
| Histidine | 0.116mg | 0% | |
| Omega-3 - EPA | 0.001g | 0g | N/A |
| Omega-3 - DHA | 0.008g | 0g | N/A |
| Omega-6 - Eicosadienoic acid | 0.001g | N/A | |
| Omega-6 - Linoleic acid | 0.215g | N/A |
Macronutrient Comparison
Macronutrient breakdown side-by-side comparison
Protein:
4.9 g
Fats:
22.2 g
Carbs:
52.2 g
Water:
19.5 g
Other:
1.2 g
Protein:
3.12 g
Fats:
0.57 g
Carbs:
5.1 g
Water:
89.61 g
Other:
1.6 g
| Contains more ProteinProtein | +57.1% |
| Contains more FatsFats | +3794.7% |
| Contains more CarbsCarbs | +923.5% |
| Contains more WaterWater | +359.5% |
| Contains more OtherOther | +33.3% |
Fat Type Comparison
Fat type breakdown side-by-side comparison
Saturated fat:
Sat. Fat
3.989 g
Monounsaturated fat:
Mono. Fat
11.181 g
Polyunsaturated fat:
Poly. Fat
5.71 g
Saturated fat:
Sat. Fat
0.065 g
Monounsaturated fat:
Mono. Fat
0.052 g
Polyunsaturated fat:
Poly. Fat
0.433 g
| Contains more Mono. FatMonounsaturated fat | +21401.9% |
| Contains more Poly. FatPolyunsaturated fat | +1218.7% |
| Contains less Sat. FatSaturated fat | -98.4% |


