Pico de gallo vs. General Mills Boo Berry — In-Depth Nutrition Comparison
Compare
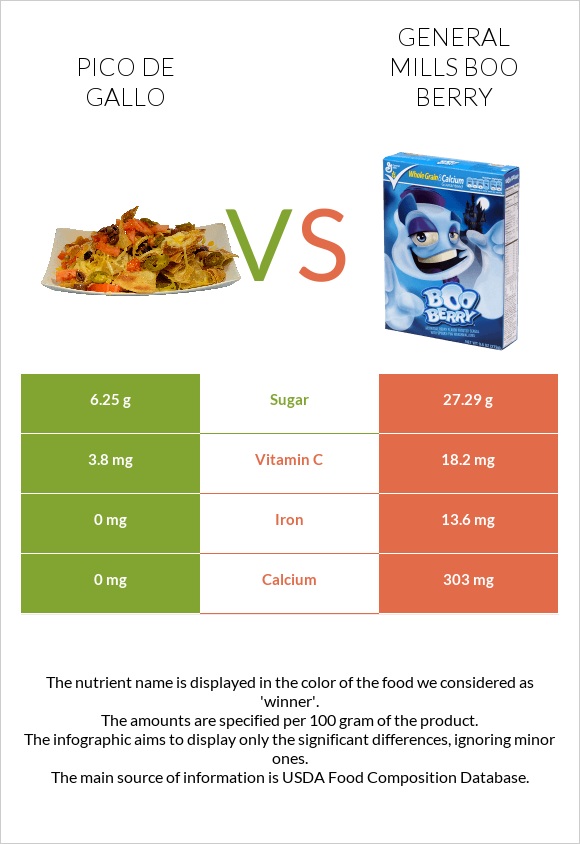
Significant differences between pico de gallo and general Mills Boo Berry
- The amount of iron, calcium, vitamin A, and vitamin C in general Mills Boo Berry is higher than in pico de gallo.
- General Mills Boo Berry covers your daily iron needs 170% more than pico de gallo.
Specific food types used in this comparison are PACE, Pico De Gallo and Cereals ready-to-eat, GENERAL MILLS, BOO BERRY.
Infographic
Infographic link
Mineral Comparison
Mineral comparison score is based on the number of minerals by which one or the other food is richer. The "coverage" charts below show how much of the daily needs can be covered by 300 grams of the food.
| Contains more CalciumCalcium | +∞% |
| Contains more IronIron | +∞% |
Vitamin Comparison
Vitamin comparison score is based on the number of vitamins by which one or the other food is richer. The "coverage" charts below show how much of the daily needs can be covered by 300 grams of the food.
| Contains more Vitamin CVitamin C | +378.9% |
All nutrients comparison - raw data values
| Nutrient |  |
 |
DV% diff. |
| Vitamin B12 | 4.5µg | 188% | |
| Iron | 0mg | 13.6mg | 170% |
| Vitamin B6 | 1.51mg | 116% | |
| Zinc | 11.39mg | 104% | |
| Vitamin B2 | 1.29mg | 99% | |
| Vitamin B3 | 15.19mg | 95% | |
| Vitamin B1 | 1.1mg | 92% | |
| Folate | 303µg | 76% | |
| Vitamin A | 421µg | 47% | |
| Calcium | 0mg | 303mg | 30% |
| Phosphorus | 182mg | 26% | |
| Carbs | 9.38g | 85.4g | 25% |
| Calories | 31kcal | 386kcal | 18% |
| Fiber | 4.2g | 17% | |
| Vitamin C | 3.8mg | 18.2mg | 16% |
| Vitamin D | 121 IU | 15% | |
| Vitamin D | 3µg | 15% | |
| Copper | 0.129mg | 14% | |
| Selenium | 6.5µg | 12% | |
| Protein | 0g | 5.5g | 11% |
| Magnesium | 48mg | 11% | |
| Polyunsaturated fat | 1.39g | 9% | |
| Fats | 0g | 4.3g | 7% |
| Potassium | 163mg | 5% | |
| Monounsaturated fat | 2.09g | 5% | |
| Vitamin E | 0.58mg | 4% | |
| Choline | 10.9mg | 2% | |
| Saturated fat | 0g | 0.5g | 2% |
| Vitamin K | 1.6µg | 1% | |
| Net carbs | 9.38g | 81.2g | N/A |
| Sugar | 6.25g | 27.29g | N/A |
| Sodium | 469mg | 458mg | 0% |
Macronutrient Comparison
Macronutrient breakdown side-by-side comparison
Protein:
0 g
Fats:
0 g
Carbs:
9.38 g
Water:
88 g
Other:
2.62 g
Protein:
5.5 g
Fats:
4.3 g
Carbs:
85.4 g
Water:
1.89 g
Other:
2.91 g
| Contains more WaterWater | +4556.1% |
| Contains more ProteinProtein | +∞% |
| Contains more FatsFats | +∞% |
| Contains more CarbsCarbs | +810.4% |
| Contains more OtherOther | +11.1% |


