Pico de gallo vs. Nachos — In-Depth Nutrition Comparison
Compare
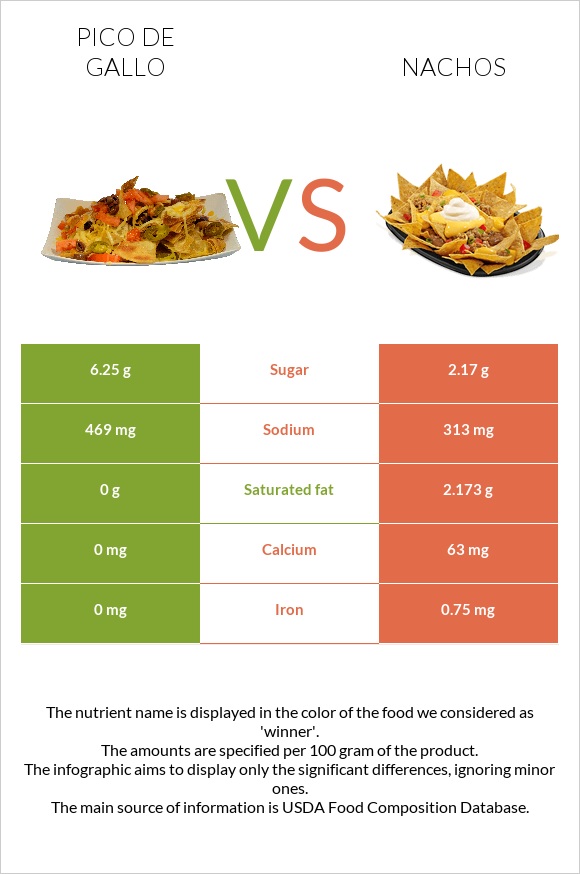
A recap on the differences between pico de gallo and nachos
- Pico de gallo is higher in vitamin A, yet nachos are higher in iron and calcium.
- Nachos cover your daily saturated fat needs 11% more than pico de gallo.
- Pico de gallo contains 15 times more vitamin A than nachos. While pico de gallo contains 313 IU of vitamin A, nachos contain only 21 IU.
- The amount of sugar in nachos is lower.
Food varieties used in this article are PACE, Pico De Gallo and Fast foods, nachos, with cheese.
Infographic
Infographic link
Mineral Comparison
Mineral comparison score is based on the number of minerals by which one or the other food is richer. The "coverage" charts below show how much of the daily needs can be covered by 300 grams of the food.
| Contains more CalciumCalcium | +∞% |
| Contains more IronIron | +∞% |
| Contains less SodiumSodium | -33.3% |
Vitamin Comparison
Vitamin comparison score is based on the number of vitamins by which one or the other food is richer. The "coverage" charts below show how much of the daily needs can be covered by 300 grams of the food.
| Contains more Vitamin CVitamin C | +245.5% |
All nutrients comparison - raw data values
| Nutrient |  |
 |
DV% diff. |
| Monounsaturated fat | 14.02g | 35% | |
| Polyunsaturated fat | 5.04g | 34% | |
| Fats | 0g | 21.5g | 33% |
| Phosphorus | 198mg | 28% | |
| Vitamin E | 4.08mg | 27% | |
| Vitamin B6 | 0.215mg | 17% | |
| Calories | 31kcal | 343kcal | 16% |
| Selenium | 8.6µg | 16% | |
| Vitamin K | 19.3µg | 16% | |
| Fiber | 3.2g | 13% | |
| Starch | 28.33g | 12% | |
| Potassium | 362mg | 11% | |
| Magnesium | 42mg | 10% | |
| Vitamin B1 | 0.123mg | 10% | |
| Vitamin B2 | 0.133mg | 10% | |
| Saturated fat | 0g | 2.173g | 10% |
| Protein | 0g | 4.32g | 9% |
| Carbs | 9.38g | 34.91g | 9% |
| Iron | 0mg | 0.75mg | 9% |
| Zinc | 0.86mg | 8% | |
| Manganese | 0.187mg | 8% | |
| Vitamin B5 | 0.38mg | 8% | |
| Copper | 0.064mg | 7% | |
| Sodium | 469mg | 313mg | 7% |
| Calcium | 0mg | 63mg | 6% |
| Choline | 26.4mg | 5% | |
| Vitamin B3 | 0.63mg | 4% | |
| Vitamin C | 3.8mg | 1.1mg | 3% |
| Vitamin B12 | 0.07µg | 3% | |
| Folate | 10µg | 3% | |
| Cholesterol | 0mg | 3mg | 1% |
| Vitamin A | 5µg | 1% | |
| Net carbs | 9.38g | 31.71g | N/A |
| Sugar | 6.25g | 2.17g | N/A |
| Trans fat | 0.058g | N/A | |
| Tryptophan | 0.042mg | 0% | |
| Threonine | 0.156mg | 0% | |
| Isoleucine | 0.187mg | 0% | |
| Leucine | 0.521mg | 0% | |
| Lysine | 0.156mg | 0% | |
| Methionine | 0.094mg | 0% | |
| Phenylalanine | 0.229mg | 0% | |
| Valine | 0.25mg | 0% | |
| Histidine | 0.135mg | 0% | |
| Omega-3 - ALA | 0.617g | N/A | |
| Omega-6 - Gamma-linoleic acid | 0.032g | N/A | |
| Omega-6 - Eicosadienoic acid | 0.011g | N/A | |
| Omega-6 - Linoleic acid | 4.343g | N/A |
Macronutrient Comparison
Macronutrient breakdown side-by-side comparison
Protein:
0 g
Fats:
0 g
Carbs:
9.38 g
Water:
88 g
Other:
2.62 g
Protein:
4.32 g
Fats:
21.5 g
Carbs:
34.91 g
Water:
37.4 g
Other:
1.87 g
| Contains more WaterWater | +135.3% |
| Contains more OtherOther | +40.1% |
| Contains more ProteinProtein | +∞% |
| Contains more FatsFats | +∞% |
| Contains more CarbsCarbs | +272.2% |


