Pinto beans vs. Kidney beans — Health Impact and Nutrition Comparison


Summary
Pinto beans are smaller and more oval than kidney beans. Regarding texture, pinto beans are softer and creamier, while kidney beans are firmer.
They are both high in vitamins, minerals, proteins, phytochemicals, and fiber, but when comparing the two, pinto beans are slightly higher in folate.
Unlike pinto beans, kidney beans contain high amounts of natural toxins called Phytohaemagglutinin (PHA), which can cause poisoning if consumed raw, soaked, or undercooked.
Introduction
Pinto Beans or Kidney Beans? As great sources of protein and fiber, beans have taken over the world as some of the best and cheapest alternatives to meat. But, if you are struggling to choose the right kind for your unique needs and recipes, this article is for you. Whether it be time constraints, digestive issues, weight loss goals, or anything else.
Overview of Differences
Appearance: You might have guessed that kidney beans earned their name because they look like mini kidneys. Their color ranges from light to dark red, and there are hence many types of kidney beans, including red kidney beans, white kidney beans, and more. In contrast, pinto beans are smaller, more oval, and come from the Spanish word “pinto,” which means “painted,” as they are covered in little speckles. They disappear after you cook them, and the color turns uniformly pink.
Taste and Texture: In terms of texture, pinto beans are softer and creamier, while kidney beans are more firm. Although they are sometimes described as tasting the same, pinto beans are often distinguished for their nutty taste, while kidney beans are known to be sweeter. Both kidney beans and pinto beans are known to be great at absorbing the flavors inside the dishes they are being cooked at.
Consumption: Pinto beans are one of the most cultivated beans in the US, especially prevalent in the cuisines of southern states and Latin America. For example, you can find them in popular dishes such as Louisiana Rice and Beans. Kidney beans are also on the list of the most consumed types of beans in the US (1). Both kidney beans and pinto beans are interchangeably used in many dishes, including chili, jambalaya, and more, although their cooking times may vary. We will talk more about them in the Cooking section of this article.
Nutritional Comparison
The average serving size for cooked, boiled beans is ½ of a cup, which is around 80-90 grams.
To make things a bit easier, let’s look at the nutritional differences between kidney beans and pinto beans for 100 grams of cooked and boiled servings.
Calories
Pinto beans are slightly higher in calories, containing 143 calories per 100g, while kidney beans have 127 calories.
Vitamins
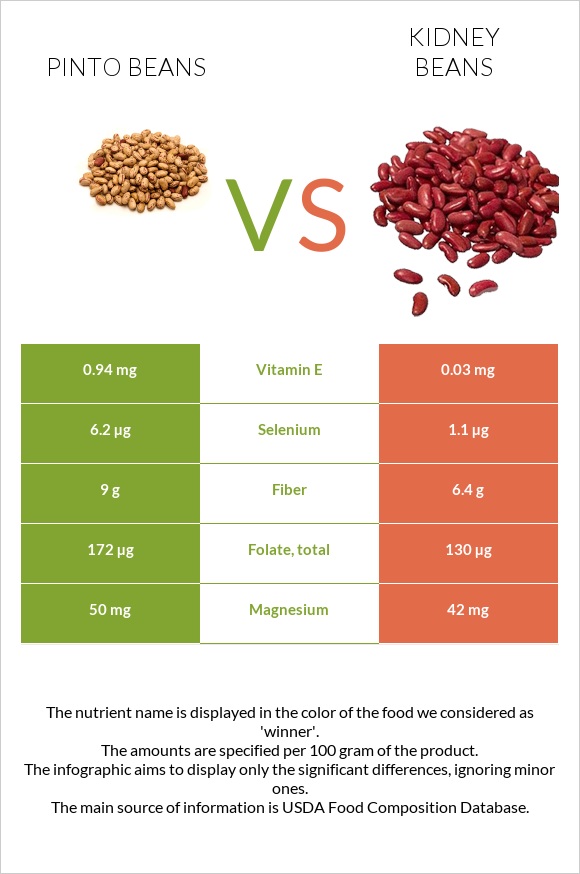
Pinto beans are a greater source of folate, containing 172µg per 100g, while kidney beans have 130µg of folate per 100g. 100g of Pinto beans cover 43% of your daily folate need.
Besides, kidney beans are also richer in Vitamin E, Vitamin B1, Vitamin B6, and choline.
When it comes to kidney beans, they contain more Vitamin C, Vitamin B3, and Vitamin K.
Folate
On average, it is recommended to take about 400µg of folate every day. This number is higher for pregnant and lactating women (600µg and 500µg respectively) per the Dietary References Intakes developed at the National Academies of Sciences, Engineering, and Medicine (3). Although beans are a great source of folate, for many pregnant and lactating women, as well as those planning their pregnancy, meeting the daily recommended needs for folate might be hard through diet alone, and additional supplements may be recommended per doctor’s guidance.
Moreover, as stated in the NIH article, research has suggested that adequate folate intake has been linked with cancer-protective properties, improved cardiovascular and cognitive functions, and more.
Vitamin Comparison
Contains
more
Vitamin EVitamin E
+3033.3%
Contains
more
Vitamin B1Vitamin B1
+20.6%
Contains
more
Vitamin B6Vitamin B6
+90.8%
Contains
more
FolateFolate
+32.3%
Contains
more
Vitamin CVitamin C
+50%
Contains
more
Vitamin B3Vitamin B3
+81.8%
Contains
more
Vitamin KVitamin K
+140%
Minerals
While both types of beans are high in minerals, pinto beans are richer in calcium, magnesium, and selenium.
However, if you want to add a good source of iron, phosphorus, potassium, zinc, manganese, and copper to your diet, both kidney and pinto beans are good choices.
Mineral Comparison
Contains
more
MagnesiumMagnesium
+19%
Contains
more
CalciumCalcium
+31.4%
Contains
more
SeleniumSelenium
+463.6%
Carbs
Pinto beans provide 26.22g of carbs per 100g, and kidney beans have 22.8g of carbs per 100g. A huge part of these carbs are net carbs. Particularly, 17.22g out of 26.22g of pinto bean carbs are net carbs, almost the same as for kidney beans.
Fiber
Per 100 grams of cooked kidney and pinto beans, you receive 6.4g and 9g of fiber, respectively. The daily need for fiber is about 25-30 grams, which means beans are also a great source of fiber; pinto beans are slightly winning in the fiber contest.
Fiber positively affects cardiovascular health, gut health, blood sugar control, and more (4).
Protein
Per 100 grams of kidney and pinto beans, you receive 8.67g and 9.01g of protein, respectively, which is great to fill up the daily protein need.
Proteins are essential for many functions, including muscle and bone repair (2). However, when calling beans an alternative to meat as a protein source, it is important to understand that they are not completely similar in content. Proteins contain amino acids, nine of which are known as the essential amino acids. Whereas animal protein sources are known to provide complete sources of all these amino acids, many plant-based protein sources, including beans, lack some of these essential amino acids.
Both pinto and kidney beans are low in tryptophan and methionine but contain adequate amounts of all the other essential amino acids. Therefore, it is recommended to pair them with other sources of protein that contain these lacking amino acids. For example, you can pair beans with rice, which is an excellent source of tryptophan and methionine. This is especially important for vegetarians and vegans who do not consume animal sources of protein with complete sources of amino acids.
Although daily protein needs vary from person to person, both beans are considered good sources of protein. So, if you are looking for cheap alternatives to meat to fill up your daily protein needs, both kidney and pinto beans will do the job, but do not forget to complement them with other sources of essential amino acids!
Phytochemicals
Both pinto and kidney beans are rich in phytochemicals that exhibit antioxidant properties. However, it is hard to compare the compositions of pinto beans to kidney beans because there are multiple types of kidney beans (ex., light red and dark red kidney beans), each having a distinct composition of phytochemicals (5).
One study aimed to determine the composition of different bean cultivates and concluded that pinto beans and red kidney beans are similar in phenolic composition and exhibit similar in vitro antioxidant activity (6). Red kidney beans had higher amounts of phenols and flavonoids than other beans. Moreover, another small study focused on a type of flavonoid found in beans called kaempferol, which was found to have anti-inflammatory effects among diabetic patients (7).
The article also discusses that beans' phenolic composition has been shown to provide anti-cancer, cardioprotective, anti-inflammatory, and antioxidant properties.
Oxalates
Both kidney and pinto beans are considered low-oxalate foods; however, in a 100g comparison, pinto beans are lower in oxalates, containing 27mg of it, while kidney beans have 40mg of oxalates.
Gastric Disturbances
If you are struggling with gastric disturbances (including gas and bloating) after eating beans, that can be attributed to the high fiber content, as well as to a type of sugar found in beans called raffinose. Raffinose cannot be digested by the upper gastrointestinal tract and ends up accumulating in the large intestine, causing gas and bloating (8).
Research has found that soaking dry beans before cooking reduces the negative effects of raffinose and other oligosaccharides that may be causing the bloating (9). You can try soaking the beans for at least 8 hours, as well as changing the cooking water several times to avoid unpleasant gastric disturbances afterward.
Please also note that there is limited research comparing the gastric disturbances caused by kidney beans and pinto beans; however, it has been found that individuals react differently to different types of beans (10). You can try both and choose the type that causes less disturbance for you.
Glycemic Index and Diabetes
The glycemic index is a rating system used for foods containing carbohydrates. The glycemic index for kidney beans is 22, while the glycemic index for pinto beans is 39. Both of these are considered low, meaning their consumption has little effect on blood sugar levels.
Moreover, small animal and human studies have confirmed that bean consumption is linked with better blood glucose control (11, 12, 13). However, there is a lack of research for large, controlled trials to understand the link between consuming various types of beans and diabetes control.
Weight Loss
Research has consistently shown that bean-based diets may potentially be great for fighting obesity (14, 15).
Per 100 grams of serving, pinto beans and kidney beans deliver 143 and 127 calories, respectively. Since both pinto beans and kidney beans have relatively low calories, are low in fats, and have high amounts of fiber and protein, they are great to help you feel full, combating overeating.
Moreover, the high fiber content will help you digest your food, and the protein will help you build up muscle after your workouts.
Storage
Dry beans should be stored in airtight containers and placed in cool and dry places.
On the day of cooking, you can let your beans cool off, portion them in airtight containers, and then put them in the freezer. Otherwise, make sure not to leave your leftovers in the refrigerator for more than 3 days.
Cooking
During the cooking of pinto and kidney beans, there are certain differences that you should keep in mind.
First, in contrast to the pinto beans, raw kidney beans, especially red kidney beans, contain high amounts of natural toxins called Phytohaemagglutinin (PHA) (16). Red kidney bean poisoning can occur if they are consumed raw, soaked, or undercooked. Before cooking the beans, it is recommended to soak them, as mentioned earlier, for at least 5-8 hours to reduce the negative gastric disturbances, but also the amount of toxins. One study strictly emphasizes the need to throw away the water used for the soaking and then boil the beans for at least 10 minutes in freshwater (17).
Second, given the larger size of kidney beans, they take about 30 to 60 minutes longer to cook than pinto beans. On average, it will take about 90 to 120 minutes to cook the kidney beans, while only 60 minutes for pinto beans. This means if you want the beans to retain their shape during long cooking when making chili, stews, or soups, kidney beans might be a better choice. But if you are mushing them to make, for example, Mexican refried beans, opt for the pinto beans. It all depends on your recipes and preferences!
If you have no time and want to ditch the dry beans altogether, canned beans are also a great alternative that requires zero effort!
Sources
- https://www.researchgate.net/publication/355199631_Patterns_of_Legume_Purchases_and_Consumption_in_the_United_States
- https://www.researchgate.net/publication/290213882_Dietary_protein_intake_and_human_health
- https://ods.od.nih.gov/factsheets/Folate-HealthProfessional/#en2
- https://academic.oup.com/ajcn/article-abstract/59/5/1242S/4732592
- https://www.ncbi.nlm.nih.gov/pmc/articles/PMC4276374/
- https://www.ncbi.nlm.nih.gov/pmc/articles/PMC7070695/
- https://pubmed.ncbi.nlm.nih.gov/26077375/
- https://www.ncbi.nlm.nih.gov/pmc/articles/PMC8891438/
- https://pubmed.ncbi.nlm.nih.gov/12489819/
- https://link.springer.com/article/10.1186/1475-2891-10-128#Abs1
- https://pubmed.ncbi.nlm.nih.gov/19526214/
- https://www.sciencedirect.com/science/article/abs/pii/S1756464617300786
- https://pubmed.ncbi.nlm.nih.gov/22494488/
- https://www.ncbi.nlm.nih.gov/pmc/articles/PMC7294352/
- https://www.ncbi.nlm.nih.gov/pmc/articles/PMC3901975/
- https://www.fda.gov/food/foodborne-pathogens/bad-bug-book-second-edition
- https://www.ncbi.nlm.nih.gov/pmc/articles/PMC2271815/pdf/epidinfect00024-0031.pdf

Infographic
All nutrients comparison - raw data values
| Nutrient | |
|
DV% diff. |
| Folate | 172µg | 130µg | 11% |
| Fiber | 9g | 6.4g | 10% |
| Selenium | 6.2µg | 1.1µg | 9% |
| Vitamin B6 | 0.229mg | 0.12mg | 8% |
| Starch | 15.15g | 6% | |
| Vitamin E | 0.94mg | 0.03mg | 6% |
| Vitamin K | 3.5µg | 8.4µg | 4% |
| Vitamin B1 | 0.193mg | 0.16mg | 3% |
| Magnesium | 50mg | 42mg | 2% |
| Iron | 2.09mg | 2.22mg | 2% |
| Vitamin B3 | 0.318mg | 0.578mg | 2% |
| Calories | 143kcal | 127kcal | 1% |
| Protein | 9.01g | 8.67g | 1% |
| Carbs | 26.22g | 22.8g | 1% |
| Calcium | 46mg | 35mg | 1% |
| Potassium | 436mg | 405mg | 1% |
| Phosphorus | 147mg | 138mg | 1% |
| Manganese | 0.453mg | 0.43mg | 1% |
| Choline | 35.3mg | 30.5mg | 1% |
| Protein per 100 calories | 6.3g | 6.8g | N/A |
| Calories per 10 g protein | 159kcal | 146kcal | N/A |
| Weight per 100 calories | 70g | 79g | N/A |
| Fats | 0.65g | 0.5g | 0% |
| Vitamin C | 0.8mg | 1.2mg | 0% |
| Net carbs | 17.22g | 16.4g | N/A |
| Sugar | 0.34g | 0.32g | N/A |
| Copper | 0.219mg | 0.216mg | 0% |
| Zinc | 0.98mg | 1mg | 0% |
| Sodium | 1mg | 1mg | 0% |
| Vitamin B2 | 0.062mg | 0.058mg | 0% |
| Vitamin B5 | 0.21mg | 0.22mg | 0% |
| Saturated fat | 0.136g | 0.073g | 0% |
| Monounsaturated fat | 0.133g | 0.039g | 0% |
| Polyunsaturated fat | 0.235g | 0.278g | 0% |
| Tryptophan | 0.108mg | 0.104mg | 0% |
| Threonine | 0.331mg | 0.319mg | 0% |
| Isoleucine | 0.426mg | 0.41mg | 0% |
| Leucine | 0.765mg | 0.736mg | 0% |
| Lysine | 0.63mg | 0.607mg | 0% |
| Methionine | 0.117mg | 0.113mg | 0% |
| Phenylalanine | 0.531mg | 0.511mg | 0% |
| Valine | 0.519mg | 0.5mg | 0% |
| Histidine | 0.247mg | 0.238mg | 0% |
Macronutrient Comparison
| Contains more FatsFats | +30% |
| Contains more CarbsCarbs | +15% |
Fat Type Comparison
| Contains more Mono. FatMonounsaturated fat | +241% |
| Contains less Sat. FatSaturated fat | -46.3% |
| Contains more Poly. FatPolyunsaturated fat | +18.3% |
People also compare


References
All the values for which the sources are not specified explicitly are taken from FDA’s Food Central. The exact link to the food presented on this page can be found below.
- Pinto beans - https://fdc.nal.usda.gov/fdc-app.html#/food-details/175200/nutrients
- Kidney beans - https://fdc.nal.usda.gov/fdc-app.html#/food-details/173740/nutrients
All the Daily Values are presented for males aged 31-50, for 2000-calorie diets.