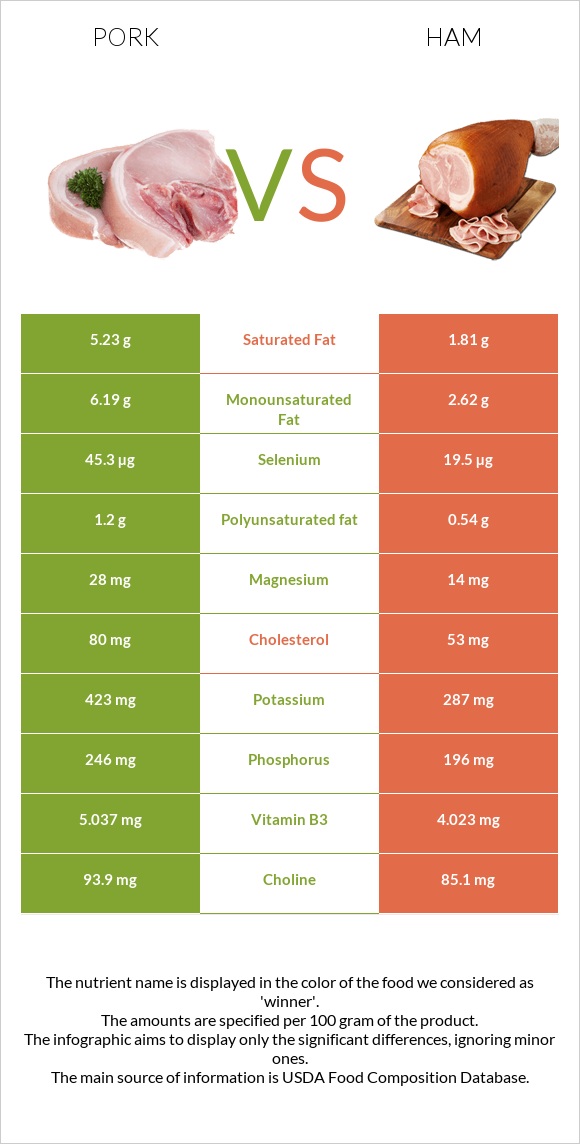
What are the main differences between pork and ham? Pork is richer in selenium, vitamin B1, vitamin B2, phosphorus, vitamin B3, and vitamin B5, yet ham is richer in iron. Ham's daily need coverage for sodium is 50% higher. Pork has 3 times more saturated fat than ham. Pork has 5.23g of saturated fat, while ham has 1.81g. We used Pork, fresh, loin, whole, separable lean, and fat, cooked, broiled and Pork, cured, ham, boneless, extra lean (approximately 5% fat), roasted types in this comparison.
Infographic
Mineral Comparison
Mineral comparison score is based on the number of minerals by which one or the other food is richer. The "coverage" charts below show how much of the daily needs can be covered by 300 grams of the food.
6
100 g
300 g
3 oz - 85g 1 chop, excluding refuse (yield from 1 raw chop, with refuse, weighing 151 g) - 87g
Magnesium
Magnesium
Calcium
Calcium
Potassium
Potassium
Iron
Iron
Copper
Copper
Zinc
Zinc
Phosphorus
Phosphorus
Sodium
Sodium
Manganese
Manganese
Selenium
Selenium
20%
5.7%
37%
33%
24%
65%
105%
8.1%
1.2%
247%
3
100 g
300 g
3 oz - 85g 1 cup - 140g
Magnesium
Magnesium
Calcium
Calcium
Potassium
Potassium
Iron
Iron
Copper
Copper
Zinc
Zinc
Phosphorus
Phosphorus
Sodium
Sodium
Manganese
Manganese
Selenium
Selenium
10%
2.4%
25%
56%
26%
79%
84%
157%
7%
106%
Vitamin Comparison
Vitamin comparison score is based on the number of vitamins by which one or the other food is richer. The "coverage" charts below show how much of the daily needs can be covered by 300 grams of the food.
10
100 g
300 g
3 oz - 85g 1 chop, excluding refuse (yield from 1 raw chop, with refuse, weighing 151 g) - 87g
Vitamin C
Vit. C
Vitamin D
Vit. D
Vitamin A
Vit. A
Vitamin E
Vit. E
Vitamin B1
Vit. B1
Vitamin B2
Vit. B2
Vitamin B3
Vit. B3
Vitamin B5
Vit. B5
Vitamin B6
Vit. B6
Vitamin B12
Vit. B12
Vitamin K
Vit. K
Folate
Folate
2%
20%
0.67%
5.8%
219%
74%
94%
42%
107%
88%
0%
3.8%
0
100 g
300 g
3 oz - 85g 1 cup - 140g
Vitamin C
Vit. C
Vitamin D
Vit. D
Vitamin A
Vit. A
Vitamin E
Vit. E
Vitamin B1
Vit. B1
Vitamin B2
Vit. B2
Vitamin B3
Vit. B3
Vitamin B5
Vit. B5
Vitamin B6
Vit. B6
Vitamin B12
Vit. B12
Vitamin K
Vit. K
Folate
Folate
0%
12%
0%
5%
189%
47%
75%
24%
92%
81%
0%
2.3%
All nutrients comparison - raw data values
Nutrient
DV% diff.
Sodium
62mg
1203mg
50%
Selenium
45.3µg
19.5µg
47%
Saturated fat
5.23g
1.81g
16%
Protein
27.32g
20.93g
13%
Fats
13.92g
5.53g
13%
Vitamin B1
0.877mg
0.754mg
10%
Cholesterol
80mg
53mg
9%
Vitamin B2
0.321mg
0.202mg
9%
Monounsaturated fat
6.19g
2.62g
9%
Iron
0.87mg
1.48mg
8%
Phosphorus
246mg
196mg
7%
Vitamin B3
5.037mg
4.023mg
6%
Vitamin B5
0.698mg
0.403mg
6%
Calories
242kcal
145kcal
5%
Vitamin B6
0.464mg
0.4mg
5%
Potassium
423mg
287mg
4%
Zinc
2.39mg
2.88mg
4%
Polyunsaturated fat
1.2g
0.54g
4%
Vitamin D*
53 IU
32 IU
3%
Vitamin D
1.3µg
0.8µg
3%
Magnesium
28mg
14mg
3%
Manganese
0.009mg
0.054mg
2%
Vitamin B12
0.7µg
0.65µg
2%
Choline
93.9mg
85.1mg
2%
Vitamin C
0.6mg
0mg
1%
Carbs
0g
1.5g
1%
Calcium
19mg
8mg
1%
Copper
0.073mg
0.079mg
1%
Folate
5µg
3µg
1%
Protein per 100 calories
11g
14g
N/A
Calories per 10 g protein
89kcal
69kcal
N/A
Weight per 100 calories
41g
69g
N/A
Unsaturated / Saturated Fat ratio
1.4
1.7
N/A
Net carbs
0g
1.5g
N/A
Vitamin A
2µg
0µg
0%
Vitamin E
0.29mg
0.25mg
0%
Tryptophan
0.338mg
0.251mg
0%
Threonine
1.234mg
0.931mg
0%
Isoleucine
1.26mg
0.918mg
0%
Leucine
2.177mg
1.661mg
0%
Lysine
2.446mg
1.775mg
0%
Methionine
0.712mg
0.553mg
0%
Phenylalanine
1.086mg
0.904mg
0%
Valine
1.473mg
0.908mg
0%
Histidine
1.067mg
0.75mg
0%
Macronutrient Comparison
Macronutrient breakdown side-by-side comparison
2
27%
14%
58%
Protein:
27.32 g
Fats:
13.92 g
Carbs:
0 g
Water:
57.87 g
Other:
0.89 g
3
21%
6%
68%
4%
Protein:
20.93 g
Fats:
5.53 g
Carbs:
1.5 g
Water:
67.67 g
Other:
4.37 g
Contains
more
Protein Protein
+30.5%
Contains
more
Fats Fats
+151.7%
Contains
more
Carbs Carbs
+∞%
Contains
more
Water Water
+16.9%
Contains
more
Other Other
+391%
Fat Type Comparison
Fat type breakdown side-by-side comparison
2
41%
49%
10%
Saturated fat:
Sat. Fat
5.23 g
Monounsaturated fat:
Mono. Fat
6.19 g
Polyunsaturated fat:
Poly. Fat
1.2 g
1
36%
53%
11%
Saturated fat:
Sat. Fat
1.81 g
Monounsaturated fat:
Mono. Fat
2.62 g
Polyunsaturated fat:
Poly. Fat
0.54 g
Contains
more
Mono. Fat Monounsaturated fat
+136.3%
Contains
more
Poly. Fat Polyunsaturated fat
+122.2%
Contains
less
Sat. Fat Saturated fat
-65.4%