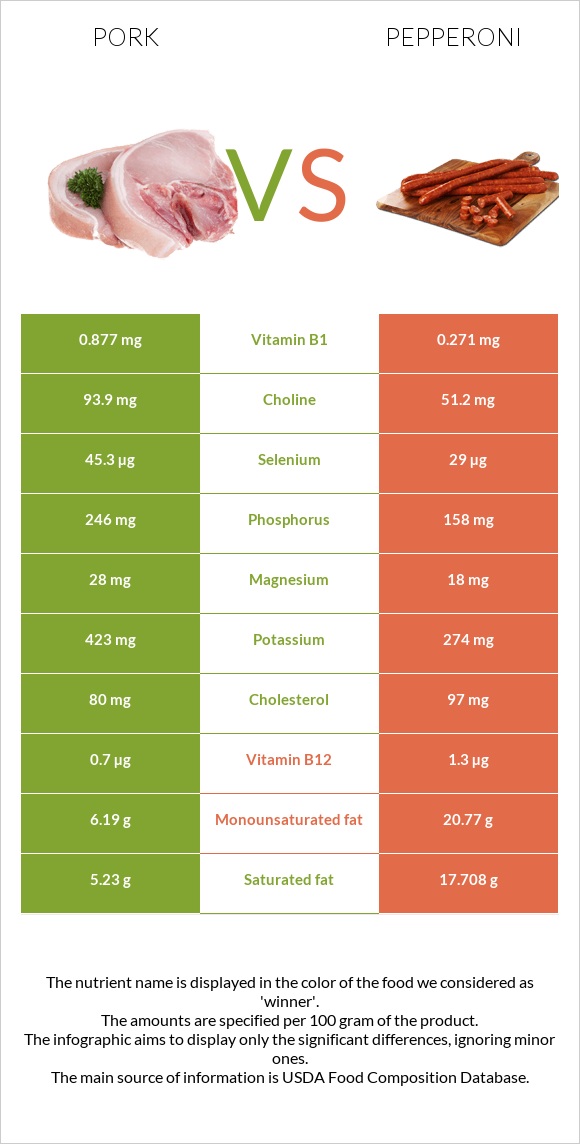
How are pork and pepperoni different? Pork is higher in vitamin B1, selenium, phosphorus, vitamin B6, and choline; however, pepperoni is richer in manganese, vitamin B12, and iron. Daily need coverage for sodium for pepperoni is 66% higher. Pork contains 3 times more vitamin B1 than pepperoni. While pork contains 0.877mg of vitamin B1, pepperoni contains only 0.271mg. Pork has less saturated fat. Pork has a lower glycemic index (0) than pepperoni (28). Pork, fresh, loin, whole, separable lean, and fat, cooked, broiled and Pepperoni, beef, and pork, sliced are the varieties used in this article.
Infographic
Mineral Comparison
Mineral comparison score is based on the number of minerals by which one or the other food is richer. The "coverage" charts below show how much of the daily needs can be covered by 300 grams of the food.
5
100 g
300 g
3 oz - 85g 1 chop, excluding refuse (yield from 1 raw chop, with refuse, weighing 151 g) - 87g
Magnesium
Magnesium
Calcium
Calcium
Potassium
Potassium
Iron
Iron
Copper
Copper
Zinc
Zinc
Phosphorus
Phosphorus
Sodium
Sodium
Manganese
Manganese
Selenium
Selenium
20%
5.7%
37%
33%
24%
65%
105%
8.1%
1.2%
247%
3
100 g
300 g
1 piece - 2g 1 oz - 28g 3 oz - 85g
Magnesium
Magnesium
Calcium
Calcium
Potassium
Potassium
Iron
Iron
Copper
Copper
Zinc
Zinc
Phosphorus
Phosphorus
Sodium
Sodium
Manganese
Manganese
Selenium
Selenium
13%
5.7%
24%
50%
30%
67%
68%
206%
140%
158%
Vitamin Comparison
Vitamin comparison score is based on the number of vitamins by which one or the other food is richer. The "coverage" charts below show how much of the daily needs can be covered by 300 grams of the food.
5
100 g
300 g
3 oz - 85g 1 chop, excluding refuse (yield from 1 raw chop, with refuse, weighing 151 g) - 87g
Vitamin C
Vit. C
Vitamin D
Vit. D
Vitamin A
Vit. A
Vitamin E
Vit. E
Vitamin B1
Vit. B1
Vitamin B2
Vit. B2
Vitamin B3
Vit. B3
Vitamin B5
Vit. B5
Vitamin B6
Vit. B6
Vitamin B12
Vit. B12
Vitamin K
Vit. K
Folate
Folate
2%
20%
0.67%
5.8%
219%
74%
94%
42%
107%
88%
0%
3.8%
4
100 g
300 g
1 piece - 2g 1 oz - 28g 3 oz - 85g
Vitamin C
Vit. C
Vitamin D
Vit. D
Vitamin A
Vit. A
Vitamin E
Vit. E
Vitamin B1
Vit. B1
Vitamin B2
Vit. B2
Vitamin B3
Vit. B3
Vitamin B5
Vit. B5
Vitamin B6
Vit. B6
Vitamin B12
Vit. B12
Vitamin K
Vit. K
Folate
Folate
0%
20%
0%
21%
68%
59%
94%
56%
84%
163%
15%
3.8%
All nutrients comparison - raw data values
Nutrient
DV% diff.
Sodium
62mg
1582mg
66%
Saturated fat
5.23g
17.708g
57%
Vitamin B1
0.877mg
0.271mg
51%
Fats
13.92g
46.28g
50%
Manganese
0.009mg
1.074mg
46%
Monounsaturated fat
6.19g
20.77g
36%
Selenium
45.3µg
29µg
30%
Vitamin B12
0.7µg
1.3µg
25%
Polyunsaturated fat
1.2g
4.458g
22%
Protein
27.32g
19.25g
16%
Calories
242kcal
504kcal
13%
Phosphorus
246mg
158mg
13%
Vitamin B6
0.464mg
0.362mg
8%
Choline
93.9mg
51.2mg
8%
Cholesterol
80mg
97mg
6%
Iron
0.87mg
1.33mg
6%
Vitamin E
0.29mg
1.03mg
5%
Vitamin B2
0.321mg
0.257mg
5%
Vitamin B5
0.698mg
0.93mg
5%
Vitamin K
0µg
5.8µg
5%
Potassium
423mg
274mg
4%
Magnesium
28mg
18mg
2%
Copper
0.073mg
0.091mg
2%
Vitamin C
0.6mg
0mg
1%
Protein per 100 calories
11g
3.8g
N/A
Calories per 10 g protein
89kcal
262kcal
N/A
Weight per 100 calories
41g
20g
N/A
Unsaturated / Saturated Fat ratio
1.4
1.4
N/A
Net carbs
0g
1.18g
N/A
Carbs
0g
1.18g
0%
Vitamin D*
53 IU
52 IU
0%
Vitamin D
1.3µg
1.3µg
0%
Calcium
19mg
19mg
0%
Zinc
2.39mg
2.44mg
0%
Vitamin A
2µg
0µg
0%
Vitamin B3
5.037mg
4.987mg
0%
Folate
5µg
5µg
0%
Trans fat
1.527g
N/A
Tryptophan
0.338mg
0.23mg
0%
Threonine
1.234mg
0.869mg
0%
Isoleucine
1.26mg
0.901mg
0%
Leucine
2.177mg
1.575mg
0%
Lysine
2.446mg
1.652mg
0%
Methionine
0.712mg
0.511mg
0%
Phenylalanine
1.086mg
0.778mg
0%
Valine
1.473mg
0.987mg
0%
Histidine
1.067mg
0.688mg
0%
Omega-3 - EPA
0g
0.004g
N/A
Omega-3 - DHA
0g
0.004g
N/A
Omega-3 - ALA
0.164g
N/A
Omega-3 - DPA
0g
0.02g
N/A
Omega-3 - Eicosatrienoic acid
0.018g
N/A
Omega-6 - Gamma-linoleic acid
0.002g
N/A
Omega-6 - Dihomo-gamma-linoleic acid
0.04g
N/A
Omega-6 - Eicosadienoic acid
0.136g
N/A
Omega-6 - Linoleic acid
3.605g
N/A
Macronutrient Comparison
Macronutrient breakdown side-by-side comparison
2
27%
14%
58%
Protein:
27.32 g
Fats:
13.92 g
Carbs:
0 g
Water:
57.87 g
Other:
0.89 g
3
19%
46%
29%
5%
Protein:
19.25 g
Fats:
46.28 g
Carbs:
1.18 g
Water:
28.55 g
Other:
4.74 g
Contains
more
Protein Protein
+41.9%
Contains
more
Water Water
+102.7%
Contains
more
Fats Fats
+232.5%
Contains
more
Carbs Carbs
+∞%
Contains
more
Other Other
+432.6%
Fat Type Comparison
Fat type breakdown side-by-side comparison
1
41%
49%
10%
Saturated fat:
Sat. Fat
5.23 g
Monounsaturated fat:
Mono. Fat
6.19 g
Polyunsaturated fat:
Poly. Fat
1.2 g
2
41%
48%
10%
Saturated fat:
Sat. Fat
17.708 g
Monounsaturated fat:
Mono. Fat
20.77 g
Polyunsaturated fat:
Poly. Fat
4.458 g
Contains
less
Sat. Fat Saturated fat
-70.5%
Contains
more
Mono. Fat Monounsaturated fat
+235.5%
Contains
more
Poly. Fat Polyunsaturated fat
+271.5%