Potato vs. Rice Nutrition Comparison — Carbs, Calories, and Glycemic Index


Summary
Potato is a root, starchy vegetable, while white rice is a refined grain.
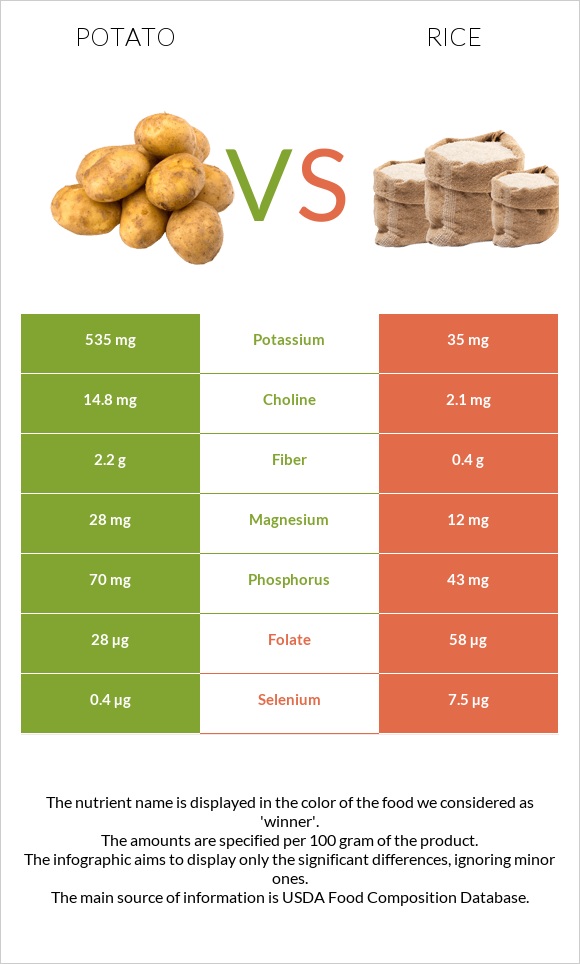
White rice is considerably higher in calories and net carbs, while potatoes are 5.5 times richer in dietary fiber. Potatoes also provide 3 times more vitamins B2 and B6, 15 times more potassium, and 2 times more magnesium.
At the same time, white rice provides 2 times more vitamin B1 and folate and 2 times less sodium.
On average, potato has higher glycemic and insulin index values.
Based on their PRAL values, potatoes are alkaline-forming, while rice is acid-forming.
Introduction
Potato is a root vegetable, while white rice is a type of refined grain; however, they are both staple foods in many cultures around the world. Potato and rice are usually cheap and dense sources of various nutrients, but how similar or different are they really? In this article, we will answer this and other questions with a primary focus on nutrition and health.
Taste and Use
Both potatoes and rice are versatile foods that can be used in a variety of dishes and preparations, but they have different tastes and uses.
Potatoes have a starchy, earthy flavor and are often used as a side dish or in dishes like mashed potatoes, potato salad, and French fries. Rice, on the other hand, has a mild, slightly nutty flavor and is used as a staple food in many cultures, as well as in dishes like rice pilaf, sushi, and risotto.
Nutrition
The nutritional information below is presented for baked potatoes (peel and flesh), without salt, and cooked regular, long-grain, enriched white rice in 100g serving sizes.
However, the average serving sizes of rice and potatoes per person are a little larger. Rice has an average serving size of one cup or 158g. At the same time, an average potato weighs around 173g, while one large and one small potato can weigh 299g and 138g, respectively.
Macronutrients and Calories
Rice and potatoes are similar in macronutrient content; however, rice is slightly denser in nutrients. Rice consists of 69% water and 31% nutrients, while potato comprises 75% water and 25% nutrients.
Calories
Cooked rice is significantly higher in calories compared to baked potatoes. A 100g serving of rice contains 130 calories, while the same serving of baked potatoes provides 93 calories.
However, it is essential to note that potatoes cooked in oil can contain significantly more calories. For example, a 100g serving of French fries contains 312 calories.
Carbohydrates
Rice is richer in overall carbohydrates, especially net carbs, while potatoes provide considerably more dietary fiber.
For every 100g serving, rice provides 7g more carbohydrates, containing 28g carbs, while potatoes have 21g.
Potatoes are 5.5 times richer in dietary fiber. The fiber found in potatoes consists of nearly equal amounts of soluble and insoluble fiber (1). Potatoes also contain more sugar, while white rice is higher in starch.
Unlike brown rice, refined white rice is low in dietary fiber, providing only 0.4g per 100g serving.
Protein
Potatoes and rice contain similar amounts of protein, with rice being slightly higher. Overall, these foods are not significant sources of protein.
A 100g serving of potato and rice provides 2.5g and 2.7g of protein, respectively.
Fats
Cooked rice and baked potatoes contain insignificant amounts of fat.
Vitamins
Potato can be considered to be the winner in this category. Potatoes are 3 times richer in vitamins B2 and B6. They also contain vitamins A, C, and K, which rice lacks entirely.
At the same time, rice contains twice as much vitamin B1 and folate (vitamin B9).
Vitamin Comparison
Contains
more
Vitamin CVitamin C
+∞%
Contains
more
Vitamin AVitamin A
+∞%
Contains
more
Vitamin B2Vitamin B2
+269.2%
Contains
more
Vitamin B6Vitamin B6
+234.4%
Contains
more
Vitamin KVitamin K
+∞%
Contains
more
Vitamin B1Vitamin B1
+154.7%
Contains
more
FolateFolate
+107.1%
Minerals
Potatoes are also overall richer in minerals, containing 15 times more potassium and 2 times more magnesium. Potatoes also contain more phosphorus, calcium, and copper.
Rice is slightly higher in zinc and iron and contains almost 2 times less sodium.
Mineral Comparison
Contains
more
MagnesiumMagnesium
+133.3%
Contains
more
CalciumCalcium
+50%
Contains
more
PotassiumPotassium
+1428.6%
Contains
more
CopperCopper
+71%
Contains
more
PhosphorusPhosphorus
+62.8%
Contains
more
IronIron
+11.1%
Contains
more
ZincZinc
+36.1%
Contains
less
SodiumSodium
-90%
Contains
more
ManganeseManganese
+115.5%
Contains
more
SeleniumSelenium
+1775%
Glycemic Index
The glycemic index of rice and potatoes can vary greatly depending on the exact variety and cooking method.
Basmati white rice has a moderate average glycemic index of 60. Meanwhile, Jasmine white rice has a higher glycemic index of 89, and brown rice has a low glycemic index of 50 (2).
A boiled potato has a high average glycemic index of 73, while a baked Irish potato has a glycemic index of 83 (2).
Overall, potato tends to have a higher average glycemic index compared to white rice.
Insulin Index
The insulin index of foods shows how much the blood insulin levels rise after consumption.
Potatoes also have a higher insulin index of 121, while the insulin index of rice is 79 (3).
Acidity
Potatoes have a pH value of around 5.4 to 5.9, while the pH values of rice fall in the range of 6 to 6.7 (4). This shows potatoes to be slightly more acidic.
However, according to their PRAL values, inside the body, potatoes are alkaline-forming, while rice is acid-forming.
Health Impact
Potatoes and rice are both nutritious foods that can be part of a healthy diet. Despite this, they might also have adverse effects on health. In this section, we will look at the facts behind the health impacts of these foods.
Cardiovascular Health
A study has found a significant correlation between white rice intake and risk factors for cardiovascular disease. However, these results regarding the correlation between refined rice intake and cardiovascular mortality were inconsistent (5).
Similarly, research states an association between higher consumption of baked, boiled, mashed, or fried potatoes and an increased risk of high blood pressure (6).
Conversely, other studies concluded that potatoes and potato nutrients might positively impact risk factors for chronic disease, including blood pressure, blood lipids, and inflammation (7).
White rice intake seems to have either an adverse or no correlation with cardiovascular risk factors, while high consumption of potatoes has either an adverse or a positive impact.
Diabetes
As mentioned previously, potatoes have higher glycemic and insulin index values compared to white rice, raising blood glucose and insulin levels quickly after intake.
However, high, consistent consumption of white rice can increase the risk of developing type 2 diabetes (8). Cutting down on white rice and adding more whole grains, vegetables, fruits, legumes, and nuts can be recommended for people trying to reduce this risk (9).
Studies of potatoes and diabetes are not conclusive. Some research does suggest a correlation between high potato consumption and the development of type 2 diabetes (10).
Sources.
- https://www.ncbi.nlm.nih.gov/pmc/articles/PMC3614039/
- https://academic.oup.com/ajcn/article/114/5/1625/6320814
- https://academic.oup.com/ajcn/article/66/5/1264/4655967
- https://www.arrowscientific.com.au/index.php?option=com_content&view=article&id=61:ph-values-of-foods-and-food-products&catid=17&Itemid=31
- https://www.ncbi.nlm.nih.gov/pmc/articles/PMC4530655/
- https://pubmed.ncbi.nlm.nih.gov/32190135/
- https://www.researchgate.net/publication/329790914
- https://care.diabetesjournals.org/content/43/11/2643
- https://care.diabetesjournals.org/content/diacare/43/11/2625.full.pdf
- https://www.ncbi.nlm.nih.gov/pmc/articles/PMC4965517/

Infographic
All nutrients comparison - raw data values
| Nutrient | |
|
DV% diff. |
| Vitamin B6 | 0.311mg | 0.093mg | 17% |
| Potassium | 535mg | 35mg | 15% |
| Selenium | 0.4µg | 7.5µg | 13% |
| Vitamin C | 9.6mg | 0mg | 11% |
| Manganese | 0.219mg | 0.472mg | 11% |
| Vitamin B1 | 0.064mg | 0.163mg | 8% |
| Folate | 28µg | 58µg | 8% |
| Fiber | 2.2g | 0.4g | 7% |
| Starch | 17.27g | 7% | |
| Copper | 0.118mg | 0.069mg | 5% |
| Magnesium | 28mg | 12mg | 4% |
| Phosphorus | 70mg | 43mg | 4% |
| Vitamin B2 | 0.048mg | 0.013mg | 3% |
| Calories | 93kcal | 130kcal | 2% |
| Carbs | 21.15g | 28.17g | 2% |
| Iron | 1.08mg | 1.2mg | 2% |
| Vitamin K | 2µg | 0µg | 2% |
| Choline | 14.8mg | 2.1mg | 2% |
| Calcium | 15mg | 10mg | 1% |
| Zinc | 0.36mg | 0.49mg | 1% |
| Protein | 2.5g | 2.69g | 0% |
| Protein per 100 calories | 2.7g | 2.1g | N/A |
| Calories per 10 g protein | 372kcal | 483kcal | N/A |
| Weight per 100 calories | 108g | 77g | N/A |
| Fats | 0.13g | 0.28g | 0% |
| Net carbs | 18.95g | 27.77g | N/A |
| Sugar | 1.18g | 0.05g | N/A |
| Sodium | 10mg | 1mg | 0% |
| Vitamin A | 1µg | 0µg | 0% |
| Vitamin E | 0.04mg | 0.04mg | 0% |
| Vitamin B3 | 1.41mg | 1.476mg | 0% |
| Vitamin B5 | 0.376mg | 0.39mg | 0% |
| Saturated fat | 0.034g | 0.077g | 0% |
| Monounsaturated fat | 0.003g | 0.088g | 0% |
| Polyunsaturated fat | 0.057g | 0.076g | 0% |
| Tryptophan | 0.025mg | 0.031mg | 0% |
| Threonine | 0.081mg | 0.096mg | 0% |
| Isoleucine | 0.08mg | 0.116mg | 0% |
| Leucine | 0.119mg | 0.222mg | 0% |
| Lysine | 0.13mg | 0.097mg | 0% |
| Methionine | 0.038mg | 0.063mg | 0% |
| Phenylalanine | 0.099mg | 0.144mg | 0% |
| Valine | 0.125mg | 0.164mg | 0% |
| Histidine | 0.042mg | 0.063mg | 0% |
| Fructose | 0.34g | 0% |
Macronutrient Comparison
| Contains more OtherOther | +216.7% |
| Contains more FatsFats | +115.4% |
| Contains more CarbsCarbs | +33.2% |
Fat Type Comparison
| Contains less Sat. FatSaturated fat | -55.8% |
| Contains more Mono. FatMonounsaturated fat | +2833.3% |
| Contains more Poly. FatPolyunsaturated fat | +33.3% |
People also compare


References
All the values for which the sources are not specified explicitly are taken from FDA’s Food Central. The exact link to the food presented on this page can be found below.
- Potato - https://fdc.nal.usda.gov/fdc-app.html#/food-details/170093/nutrients
- Rice - https://fdc.nal.usda.gov/fdc-app.html#/food-details/168878/nutrients
All the Daily Values are presented for males aged 31-50, for 2000-calorie diets.