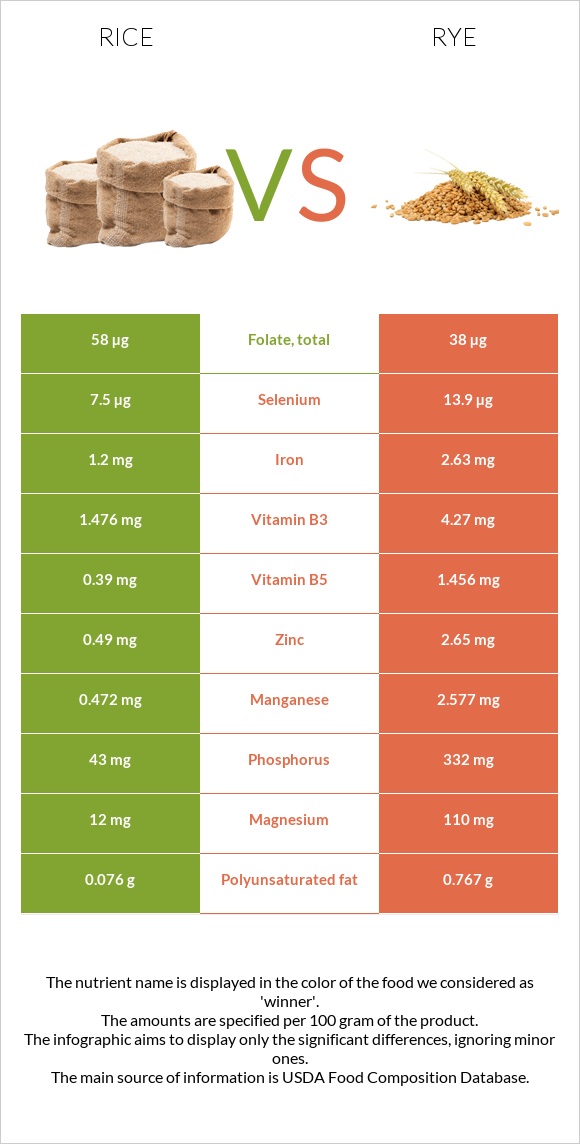
What are the differences between rice and rye? Rye is richer than rice in manganese, fiber, phosphorus, copper, magnesium, vitamin B5, zinc, vitamin B2, iron, and vitamin B3. Rye's daily need coverage for manganese is 92% more. The glycemic index of rye is lower. We used Rice, white, long-grain, regular, enriched, cooked and Rye grain types in this article.
Infographic
Mineral Comparison
Mineral comparison score is based on the number of minerals by which one or the other food is richer. The "coverage" charts below show how much of the daily needs can be covered by 300 grams of the food.
1
100 g
300 g
1 cup - 158g
Magnesium
Magnesium
Calcium
Calcium
Potassium
Potassium
Iron
Iron
Copper
Copper
Zinc
Zinc
Phosphorus
Phosphorus
Sodium
Sodium
Manganese
Manganese
Selenium
Selenium
8.6%
3%
3.1%
45%
23%
13%
18%
0.13%
62%
41%
9
100 g
300 g
1 cup - 169g
Magnesium
Magnesium
Calcium
Calcium
Potassium
Potassium
Iron
Iron
Copper
Copper
Zinc
Zinc
Phosphorus
Phosphorus
Sodium
Sodium
Manganese
Manganese
Selenium
Selenium
79%
7.2%
45%
99%
122%
72%
142%
0.26%
336%
76%
Vitamin Comparison
Vitamin comparison score is based on the number of vitamins by which one or the other food is richer. The "coverage" charts below show how much of the daily needs can be covered by 300 grams of the food.
1
100 g
300 g
1 cup - 158g
Vitamin C
Vit. C
Vitamin D
Vit. D
Vitamin A
Vit. A
Vitamin E
Vit. E
Vitamin B1
Vit. B1
Vitamin B2
Vit. B2
Vitamin B3
Vit. B3
Vitamin B5
Vit. B5
Vitamin B6
Vit. B6
Vitamin B12
Vit. B12
Vitamin K
Vit. K
Folate
Folate
0%
0%
0%
0.8%
41%
3%
28%
23%
21%
0%
0%
44%
8
100 g
300 g
1 cup - 169g
Vitamin C
Vit. C
Vitamin D
Vit. D
Vitamin A
Vit. A
Vitamin E
Vit. E
Vitamin B1
Vit. B1
Vitamin B2
Vit. B2
Vitamin B3
Vit. B3
Vitamin B5
Vit. B5
Vitamin B6
Vit. B6
Vitamin B12
Vit. B12
Vitamin K
Vit. K
Folate
Folate
0%
0%
0.33%
17%
79%
58%
80%
87%
68%
0%
15%
29%
All nutrients comparison - raw data values
Nutrient
DV% diff.
Manganese
0.472mg
2.577mg
92%
Fiber
0.4g
15.1g
59%
Phosphorus
43mg
332mg
41%
Copper
0.069mg
0.367mg
33%
Magnesium
12mg
110mg
23%
Vitamin B5
0.39mg
1.456mg
21%
Zinc
0.49mg
2.65mg
20%
Iron
1.2mg
2.63mg
18%
Vitamin B2
0.013mg
0.251mg
18%
Vitamin B3
1.476mg
4.27mg
17%
Carbs
28.17g
75.86g
16%
Protein
2.69g
10.34g
15%
Vitamin B6
0.093mg
0.294mg
15%
Potassium
35mg
510mg
14%
Vitamin B1
0.163mg
0.316mg
13%
Selenium
7.5µg
13.9µg
12%
Calories
130kcal
338kcal
10%
Vitamin E
0.04mg
0.85mg
5%
Vitamin K
0µg
5.9µg
5%
Folate
58µg
38µg
5%
Choline
2.1mg
30.4mg
5%
Polyunsaturated fat
0.076g
0.767g
5%
Fats
0.28g
1.63g
2%
Calcium
10mg
24mg
1%
Saturated fat
0.077g
0.197g
1%
Protein per 100 calories
2.1g
3.1g
N/A
Calories per 10 g protein
483kcal
327kcal
N/A
Weight per 100 calories
77g
30g
N/A
Net carbs
27.77g
60.76g
N/A
Sugar
0.05g
0.98g
N/A
Sodium
1mg
2mg
0%
Vitamin A
0µg
1µg
0%
Monounsaturated fat
0.088g
0.208g
0%
Tryptophan
0.031mg
0.108mg
0%
Threonine
0.096mg
0.289mg
0%
Isoleucine
0.116mg
0.208mg
0%
Leucine
0.222mg
0.563mg
0%
Lysine
0.097mg
0.286mg
0%
Methionine
0.063mg
0.153mg
0%
Phenylalanine
0.144mg
0.435mg
0%
Valine
0.164mg
0.317mg
0%
Histidine
0.063mg
0.189mg
0%
Fructose
0.11g
0%
Macronutrient Comparison
Macronutrient breakdown side-by-side comparison
1
3%
28%
68%
Protein:
2.69 g
Fats:
0.28 g
Carbs:
28.17 g
Water:
68.44 g
Other:
0.42 g
4
10%
76%
11%
Protein:
10.34 g
Fats:
1.63 g
Carbs:
75.86 g
Water:
10.6 g
Other:
1.57 g
Contains
more
Water Water
+545.7%
Contains
more
Protein Protein
+284.4%
Contains
more
Fats Fats
+482.1%
Contains
more
Carbs Carbs
+169.3%
Contains
more
Other Other
+273.8%
Fat Type Comparison
Fat type breakdown side-by-side comparison
1
32%
37%
32%
Saturated fat:
Sat. Fat
0.077 g
Monounsaturated fat:
Mono. Fat
0.088 g
Polyunsaturated fat:
Poly. Fat
0.076 g
2
17%
18%
65%
Saturated fat:
Sat. Fat
0.197 g
Monounsaturated fat:
Mono. Fat
0.208 g
Polyunsaturated fat:
Poly. Fat
0.767 g
Contains
less
Sat. Fat Saturated fat
-60.9%
Contains
more
Mono. Fat Monounsaturated fat
+136.4%
Contains
more
Poly. Fat Polyunsaturated fat
+909.2%