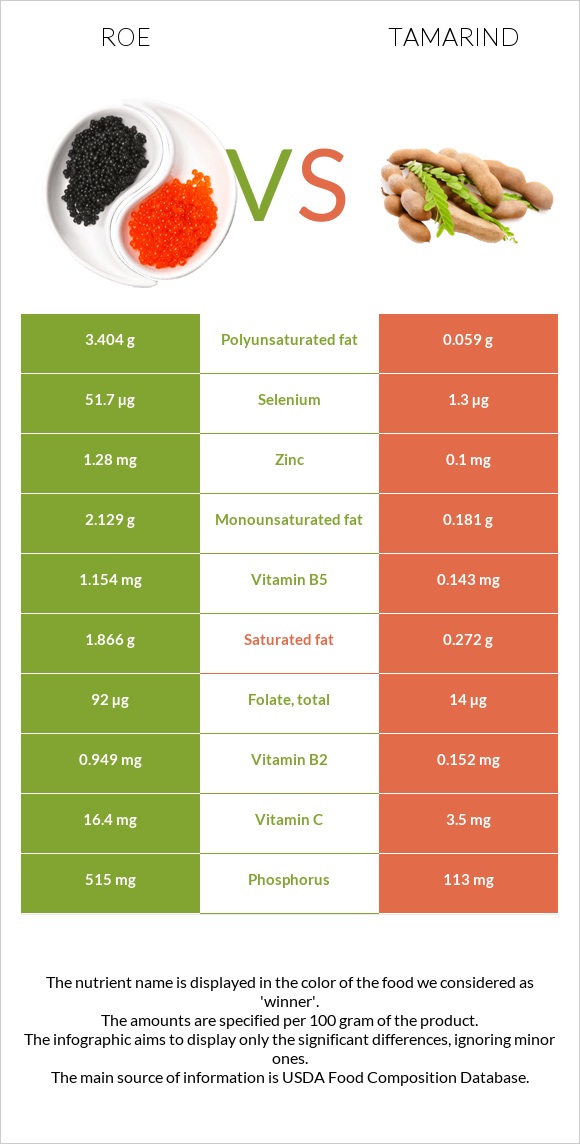
How are roe and tamarind different? Roe is higher in vitamin B12, selenium, vitamin B2, phosphorus, vitamin B5, and folate; however, tamarind is richer in iron, fiber, and magnesium. Daily need coverage for vitamin B12 for roe is 481% higher. Fish, roe, mixed species, cooked, dry heat and Tamarinds, raw are the varieties used in this article.
Infographic
Mineral Comparison
Mineral comparison score is based on the number of minerals by which one or the other food is richer. The "coverage" charts below show how much of the daily needs can be covered by 300 grams of the food.
5
100 g
300 g
1 oz - 28.35g 3 oz - 85g
Magnesium
Magnesium
Calcium
Calcium
Potassium
Potassium
Iron
Iron
Copper
Copper
Zinc
Zinc
Phosphorus
Phosphorus
Sodium
Sodium
Manganese
Manganese
Selenium
Selenium
19%
8.4%
25%
29%
43%
35%
221%
15%
1.7%
282%
5
100 g
300 g
1 fruit (3" x 1") - 2g 1 cup, pulp - 120g
Magnesium
Magnesium
Calcium
Calcium
Potassium
Potassium
Iron
Iron
Copper
Copper
Zinc
Zinc
Phosphorus
Phosphorus
Sodium
Sodium
Manganese
Manganese
Selenium
Selenium
66%
22%
55%
105%
29%
2.7%
48%
3.7%
0%
7.1%
Vitamin Comparison
Vitamin comparison score is based on the number of vitamins by which one or the other food is richer. The "coverage" charts below show how much of the daily needs can be covered by 300 grams of the food.
8
100 g
300 g
1 oz - 28.35g 3 oz - 85g
Vitamin C
Vit. C
Vitamin D
Vit. D
Vitamin A
Vit. A
Vitamin E
Vit. E
Vitamin B1
Vit. B1
Vitamin B2
Vit. B2
Vitamin B3
Vit. B3
Vitamin B5
Vit. B5
Vitamin B6
Vit. B6
Vitamin B12
Vit. B12
Vitamin K
Vit. K
Folate
Folate
55%
0%
30%
0%
69%
219%
41%
69%
43%
1443%
0%
69%
3
100 g
300 g
1 fruit (3" x 1") - 2g 1 cup, pulp - 120g
Vitamin C
Vit. C
Vitamin D
Vit. D
Vitamin A
Vit. A
Vitamin E
Vit. E
Vitamin B1
Vit. B1
Vitamin B2
Vit. B2
Vitamin B3
Vit. B3
Vitamin B5
Vit. B5
Vitamin B6
Vit. B6
Vitamin B12
Vit. B12
Vitamin K
Vit. K
Folate
Folate
12%
0%
0.67%
2%
107%
35%
36%
8.6%
15%
0%
7%
11%
All nutrients comparison - raw data values
Nutrient
DV% diff.
Vitamin B12
11.54µg
0µg
481%
Cholesterol
479mg
0mg
160%
Selenium
51.7µg
1.3µg
92%
Vitamin B2
0.949mg
0.152mg
61%
Phosphorus
515mg
113mg
57%
Protein
28.62g
2.8g
52%
Iron
0.77mg
2.8mg
25%
Polyunsaturated fat
3.404g
0.059g
22%
Carbs
1.92g
62.5g
20%
Fiber
0g
5.1g
20%
Vitamin B5
1.154mg
0.143mg
20%
Folate
92µg
14µg
20%
Magnesium
26mg
92mg
16%
Vitamin C
16.4mg
3.5mg
14%
Vitamin B1
0.277mg
0.428mg
13%
Fats
8.23g
0.6g
12%
Zinc
1.28mg
0.1mg
11%
Potassium
283mg
628mg
10%
Vitamin A
91µg
2µg
10%
Vitamin B6
0.185mg
0.066mg
9%
Saturated fat
1.866g
0.272g
7%
Calcium
28mg
74mg
5%
Copper
0.128mg
0.086mg
5%
Monounsaturated fat
2.129g
0.181g
5%
Sodium
117mg
28mg
4%
Calories
204kcal
239kcal
2%
Vitamin B3
2.192mg
1.938mg
2%
Vitamin K
2.8µg
2%
Choline
8.6mg
2%
Vitamin E
0.1mg
1%
Manganese
0.013mg
1%
Protein per 100 calories
14g
1.2g
N/A
Calories per 10 g protein
71kcal
854kcal
N/A
Weight per 100 calories
49g
42g
N/A
Unsaturated / Saturated Fat ratio
3
0.88
N/A
Net carbs
1.92g
57.4g
N/A
Sugar
38.8g
N/A
Tryptophan
0.375mg
0.018mg
0%
Threonine
1.305mg
0%
Isoleucine
1.465mg
0%
Leucine
2.509mg
0%
Lysine
2.179mg
0.139mg
0%
Methionine
0.71mg
0.014mg
0%
Phenylalanine
1.401mg
0%
Valine
1.676mg
0%
Histidine
0.778mg
0%
Omega-3 - EPA
1.26g
0g
N/A
Omega-3 - DHA
1.747g
0g
N/A
Omega-3 - DPA
0.105g
0g
N/A
Macronutrient Comparison
Macronutrient breakdown side-by-side comparison
3
29%
8%
2%
59%
3%
Protein:
28.62 g
Fats:
8.23 g
Carbs:
1.92 g
Water:
58.63 g
Other:
2.6 g
2
3%
63%
31%
3%
Protein:
2.8 g
Fats:
0.6 g
Carbs:
62.5 g
Water:
31.4 g
Other:
2.7 g
Contains
more
Protein Protein
+922.1%
Contains
more
Fats Fats
+1271.7%
Contains
more
Water Water
+86.7%
Contains
more
Carbs Carbs
+3155.2%
Fat Type Comparison
Fat type breakdown side-by-side comparison
2
25%
29%
46%
Saturated fat:
Sat. Fat
1.866 g
Monounsaturated fat:
Mono. Fat
2.129 g
Polyunsaturated fat:
Poly. Fat
3.404 g
1
53%
35%
12%
Saturated fat:
Sat. Fat
0.272 g
Monounsaturated fat:
Mono. Fat
0.181 g
Polyunsaturated fat:
Poly. Fat
0.059 g
Contains
more
Mono. Fat Monounsaturated fat
+1076.2%
Contains
more
Poly. Fat Polyunsaturated fat
+5669.5%
Contains
less
Sat. Fat Saturated fat
-85.4%