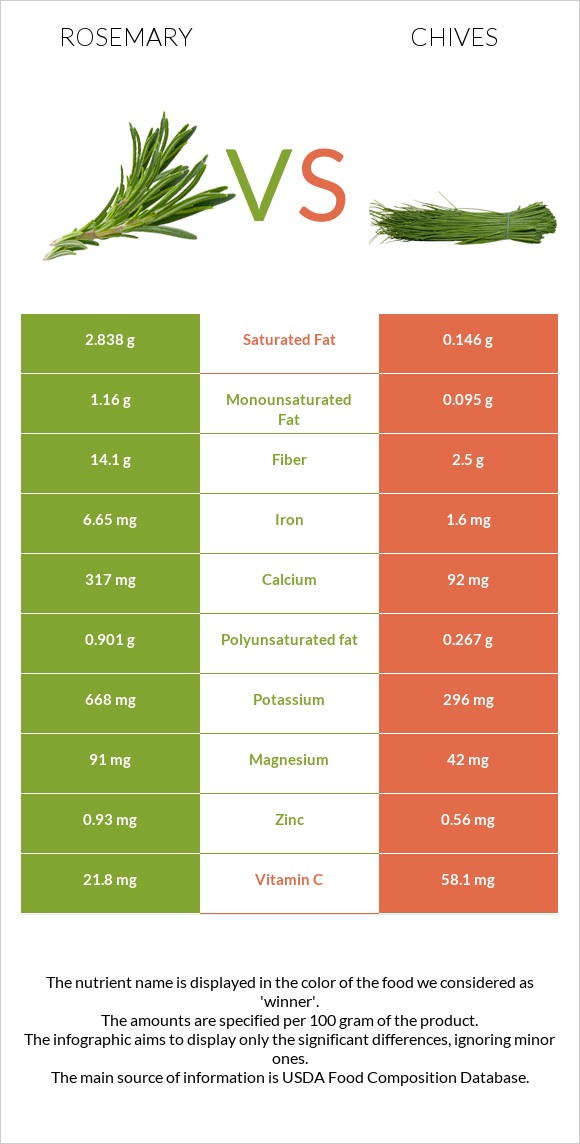
How are rosemary and chives different? Rosemary is higher in iron, fiber, manganese, calcium, copper, vitamin B6, and magnesium; however, chives are richer in vitamin C and vitamin A. Daily need coverage for iron for rosemary is 63% higher. Rosemary contains 19 times more saturated fat than chives. While rosemary contains 2.838g of saturated fat, chives contain only 0.146g. Chives have a lower glycemic index (45) than rosemary (70). Rosemary, fresh and Chives, raw are the varieties used in this article.
Infographic
Mineral Comparison
Mineral comparison score is based on the number of minerals by which one or the other food is richer. The "coverage" charts below show how much of the daily needs can be covered by 300 grams of the food.
8
100 g
300 g
1 tsp - 0.7g 1 tbsp - 1.7g
Magnesium
Magnesium
Calcium
Calcium
Potassium
Potassium
Iron
Iron
Copper
Copper
Zinc
Zinc
Phosphorus
Phosphorus
Sodium
Sodium
Manganese
Manganese
Selenium
Selenium
65%
95%
59%
249%
100%
25%
28%
3.4%
125%
0%
2
100 g
300 g
1 tsp chopped - 1g 1 tbsp chopped - 3g
Magnesium
Magnesium
Calcium
Calcium
Potassium
Potassium
Iron
Iron
Copper
Copper
Zinc
Zinc
Phosphorus
Phosphorus
Sodium
Sodium
Manganese
Manganese
Selenium
Selenium
30%
28%
26%
60%
52%
15%
25%
0.39%
49%
4.9%
Vitamin Comparison
Vitamin comparison score is based on the number of vitamins by which one or the other food is richer. The "coverage" charts below show how much of the daily needs can be covered by 300 grams of the food.
4
100 g
300 g
1 tsp - 0.7g 1 tbsp - 1.7g
Vitamin C
Vit. C
Vitamin D
Vit. D
Vitamin A
Vit. A
Vitamin E
Vit. E
Vitamin B1
Vit. B1
Vitamin B2
Vit. B2
Vitamin B3
Vit. B3
Vitamin B5
Vit. B5
Vitamin B6
Vit. B6
Vitamin B12
Vit. B12
Vitamin K
Vit. K
Folate
Folate
73%
0%
49%
0%
9%
35%
17%
48%
78%
0%
0%
82%
5
100 g
300 g
1 tsp chopped - 1g 1 tbsp chopped - 3g
Vitamin C
Vit. C
Vitamin D
Vit. D
Vitamin A
Vit. A
Vitamin E
Vit. E
Vitamin B1
Vit. B1
Vitamin B2
Vit. B2
Vitamin B3
Vit. B3
Vitamin B5
Vit. B5
Vitamin B6
Vit. B6
Vitamin B12
Vit. B12
Vitamin K
Vit. K
Folate
Folate
194%
0%
73%
4.2%
20%
27%
12%
19%
32%
0%
532%
79%
All nutrients comparison - raw data values
Nutrient
DV% diff.
Vitamin K
212.7µg
177%
Iron
6.65mg
1.6mg
63%
Fiber
14.1g
2.5g
46%
Vitamin C
21.8mg
58.1mg
40%
Manganese
0.96mg
0.373mg
26%
Calcium
317mg
92mg
23%
Copper
0.301mg
0.157mg
16%
Vitamin B6
0.336mg
0.138mg
15%
Magnesium
91mg
42mg
12%
Saturated fat
2.838g
0.146g
12%
Potassium
668mg
296mg
11%
Vitamin B5
0.804mg
0.324mg
10%
Fats
5.86g
0.73g
8%
Vitamin A
146µg
218µg
8%
Calories
131kcal
30kcal
5%
Carbs
20.7g
4.35g
5%
Vitamin B1
0.036mg
0.078mg
4%
Polyunsaturated fat
0.901g
0.267g
4%
Zinc
0.93mg
0.56mg
3%
Vitamin B2
0.152mg
0.115mg
3%
Monounsaturated fat
1.16g
0.095g
3%
Selenium
0.9µg
2%
Vitamin B3
0.912mg
0.647mg
2%
Phosphorus
66mg
58mg
1%
Sodium
26mg
3mg
1%
Vitamin E
0.21mg
1%
Folate
109µg
105µg
1%
Choline
5.2mg
1%
Protein
3.31g
3.27g
0%
Protein per 100 calories
2.5g
11g
N/A
Calories per 10 g protein
396kcal
92kcal
N/A
Weight per 100 calories
76g
333g
N/A
Unsaturated / Saturated Fat ratio
0.73
2.5
N/A
Net carbs
6.6g
1.85g
N/A
Sugar
1.85g
N/A
Tryptophan
0.051mg
0.037mg
0%
Threonine
0.136mg
0.128mg
0%
Isoleucine
0.136mg
0.139mg
0%
Leucine
0.249mg
0.195mg
0%
Lysine
0.143mg
0.163mg
0%
Methionine
0.047mg
0.036mg
0%
Phenylalanine
0.169mg
0.105mg
0%
Valine
0.165mg
0.145mg
0%
Histidine
0.066mg
0.057mg
0%
Macronutrient Comparison
Macronutrient breakdown side-by-side comparison
4
3%
6%
21%
68%
2%
Protein:
3.31 g
Fats:
5.86 g
Carbs:
20.7 g
Water:
67.77 g
Other:
2.36 g
1
3%
4%
91%
Protein:
3.27 g
Fats:
0.73 g
Carbs:
4.35 g
Water:
90.65 g
Other:
1 g
Contains
more
Fats Fats
+702.7%
Contains
more
Carbs Carbs
+375.9%
Contains
more
Other Other
+136%
Contains
more
Water Water
+33.8%
Fat Type Comparison
Fat type breakdown side-by-side comparison
2
58%
24%
18%
Saturated fat:
Sat. Fat
2.838 g
Monounsaturated fat:
Mono. Fat
1.16 g
Polyunsaturated fat:
Poly. Fat
0.901 g
1
29%
19%
53%
Saturated fat:
Sat. Fat
0.146 g
Monounsaturated fat:
Mono. Fat
0.095 g
Polyunsaturated fat:
Poly. Fat
0.267 g
Contains
more
Mono. Fat Monounsaturated fat
+1121.1%
Contains
more
Poly. Fat Polyunsaturated fat
+237.5%
Contains
less
Sat. Fat Saturated fat
-94.9%