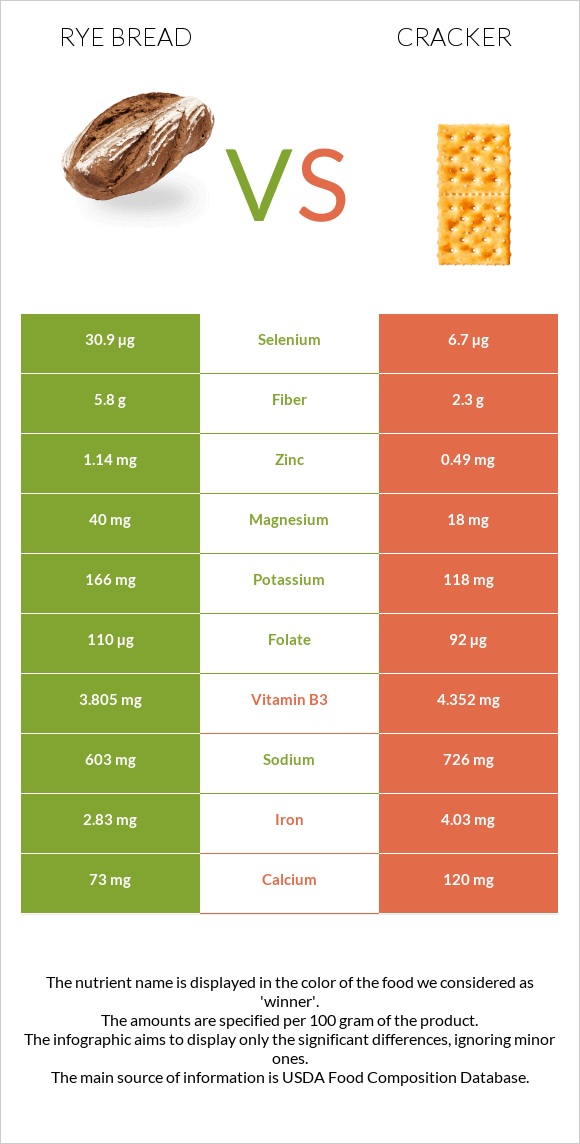
How are rye bread and crackers different? Rye bread is higher in selenium, manganese, fiber, and copper; however, crackers are richer in vitamin K, vitamin E, phosphorus, iron, and vitamin B2. Daily need coverage for vitamin K for crackers is 57% higher. Rye bread contains 5 times more selenium than crackers. While rye bread contains 30.9µg of selenium, crackers contain only 6.7µg. Rye bread has less saturated fat. Bread, rye and Crackers, standard snack-type, regular are the varieties used in this article.
Infographic
Mineral Comparison
Mineral comparison score is based on the number of minerals by which one or the other food is richer. The "coverage" charts below show how much of the daily needs can be covered by 300 grams of the food.
7
100 g
300 g
1 slice, snack-size - 7g 1 slice, thin - 25g 1 oz - 28.35g 1 slice, regular - 32g
Magnesium
Magnesium
Calcium
Calcium
Potassium
Potassium
Iron
Iron
Copper
Copper
Zinc
Zinc
Phosphorus
Phosphorus
Sodium
Sodium
Manganese
Manganese
Selenium
Selenium
29%
22%
15%
106%
62%
31%
54%
79%
107%
169%
3
100 g
300 g
1 cracker, round - 3.2g 1 cracker, rectangular - 4g 5 crackers - 16g 5 crackers, regular size, round (1 serving) - 16g 1 cup crushed - 52g
Magnesium
Magnesium
Calcium
Calcium
Potassium
Potassium
Iron
Iron
Copper
Copper
Zinc
Zinc
Phosphorus
Phosphorus
Sodium
Sodium
Manganese
Manganese
Selenium
Selenium
13%
36%
10%
151%
35%
13%
106%
95%
64%
37%
Vitamin Comparison
Vitamin comparison score is based on the number of vitamins by which one or the other food is richer. The "coverage" charts below show how much of the daily needs can be covered by 300 grams of the food.
3
100 g
300 g
1 slice, snack-size - 7g 1 slice, thin - 25g 1 oz - 28.35g 1 slice, regular - 32g
Vitamin C
Vit. C
Vitamin D
Vit. D
Vitamin A
Vit. A
Vitamin E
Vit. E
Vitamin B1
Vit. B1
Vitamin B2
Vit. B2
Vitamin B3
Vit. B3
Vitamin B5
Vit. B5
Vitamin B6
Vit. B6
Vitamin B12
Vit. B12
Vitamin K
Vit. K
Folate
Folate
1.3%
0%
0%
6.6%
109%
77%
71%
26%
17%
0%
3%
83%
4
100 g
300 g
1 cracker, round - 3.2g 1 cracker, rectangular - 4g 5 crackers - 16g 5 crackers, regular size, round (1 serving) - 16g 1 cup crushed - 52g
Vitamin C
Vit. C
Vitamin D
Vit. D
Vitamin A
Vit. A
Vitamin E
Vit. E
Vitamin B1
Vit. B1
Vitamin B2
Vit. B2
Vitamin B3
Vit. B3
Vitamin B5
Vit. B5
Vitamin B6
Vit. B6
Vitamin B12
Vit. B12
Vitamin K
Vit. K
Folate
Folate
0%
0%
0%
61%
104%
105%
82%
25%
15%
0%
173%
69%
All nutrients comparison - raw data values
Nutrient
DV% diff.
Polyunsaturated fat
0.799g
13.137g
82%
Vitamin K
1.2µg
69.3µg
57%
Selenium
30.9µg
6.7µg
44%
Fats
3.3g
26.43g
36%
Saturated fat
0.626g
5.562g
22%
Starch
49.69g
20%
Phosphorus
125mg
248mg
18%
Vitamin E
0.33mg
3.03mg
18%
Iron
2.83mg
4.03mg
15%
Fiber
5.8g
2.3g
14%
Manganese
0.824mg
0.491mg
14%
Calories
259kcal
510kcal
13%
Monounsaturated fat
1.311g
6.553g
13%
Copper
0.186mg
0.104mg
9%
Vitamin B2
0.335mg
0.456mg
9%
Zinc
1.14mg
0.49mg
6%
Magnesium
40mg
18mg
5%
Calcium
73mg
120mg
5%
Sodium
603mg
726mg
5%
Folate
110µg
92µg
5%
Protein
8.5g
6.64g
4%
Carbs
48.3g
61.3g
4%
Vitamin B3
3.805mg
4.352mg
3%
Vitamin B1
0.434mg
0.416mg
2%
Potassium
166mg
118mg
1%
Vitamin B6
0.075mg
0.063mg
1%
Choline
14.6mg
9.6mg
1%
Protein per 100 calories
3.3g
1.3g
N/A
Calories per 10 g protein
305kcal
768kcal
N/A
Weight per 100 calories
39g
20g
N/A
Unsaturated / Saturated Fat ratio
3.4
3.5
N/A
Vitamin C
0.4mg
0mg
0%
Net carbs
42.5g
59g
N/A
Sugar
3.85g
8.18g
N/A
Vitamin B5
0.44mg
0.417mg
0%
Trans fat
1.076g
N/A
Tryptophan
0.096mg
0.084mg
0%
Threonine
0.255mg
0.193mg
0%
Isoleucine
0.319mg
0.246mg
0%
Leucine
0.579mg
0.471mg
0%
Lysine
0.233mg
0.103mg
0%
Methionine
0.139mg
0.112mg
0%
Phenylalanine
0.411mg
0.331mg
0%
Valine
0.379mg
0.294mg
0%
Histidine
0.182mg
0.145mg
0%
Fructose
0.29g
0%
Omega-3 - ALA
1.485g
N/A
Omega-6 - Gamma-linoleic acid
0.062g
N/A
Omega-6 - Eicosadienoic acid
0.009g
N/A
Omega-6 - Linoleic acid
11.48g
N/A
Macronutrient Comparison
Macronutrient breakdown side-by-side comparison
3
9%
3%
48%
37%
3%
Protein:
8.5 g
Fats:
3.3 g
Carbs:
48.3 g
Water:
37.3 g
Other:
2.6 g
2
7%
26%
61%
3%
2%
Protein:
6.64 g
Fats:
26.43 g
Carbs:
61.3 g
Water:
3.14 g
Other:
2.49 g
Contains
more
Protein Protein
+28%
Contains
more
Water Water
+1087.9%
Contains
more
Fats Fats
+700.9%
Contains
more
Carbs Carbs
+26.9%
Fat Type Comparison
Fat type breakdown side-by-side comparison
1
23%
48%
29%
Saturated fat:
Sat. Fat
0.626 g
Monounsaturated fat:
Mono. Fat
1.311 g
Polyunsaturated fat:
Poly. Fat
0.799 g
2
22%
26%
52%
Saturated fat:
Sat. Fat
5.562 g
Monounsaturated fat:
Mono. Fat
6.553 g
Polyunsaturated fat:
Poly. Fat
13.137 g
Contains
less
Sat. Fat Saturated fat
-88.7%
Contains
more
Mono. Fat Monounsaturated fat
+399.8%
Contains
more
Poly. Fat Polyunsaturated fat
+1544.2%