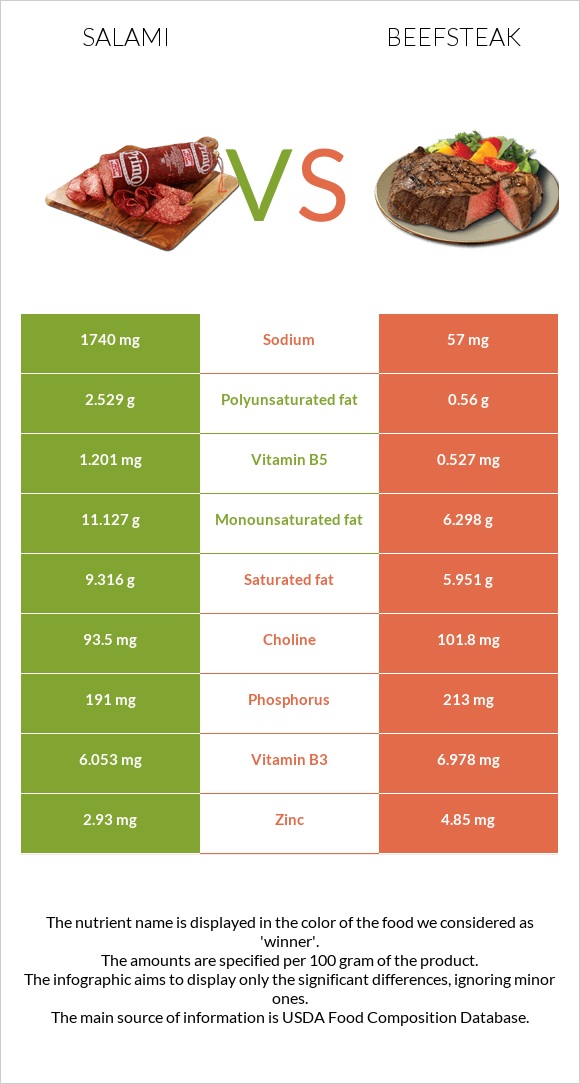
Summary of differences between salami and beefsteak Salami has more manganese, copper, vitamin B1, vitamin B2, vitamin B5, and vitamin B12; however, beefsteak is higher in zinc and vitamin B6. Salami covers your daily need for sodium, 73% more than beefsteak. Salami has 109 times more manganese than beefsteak. While salami has 0.978mg of manganese, beefsteak has only 0.009mg. Beefsteak has less sodium. The glycemic index of salami is higher. These are the specific foods used in this comparison Salami, cooked, beef, and pork and Beef, loin, top loin, separable lean, and fat, trimmed to 1/8" fat, select, cooked, grilled .
Infographic
Mineral Comparison
Mineral comparison score is based on the number of minerals by which one or the other food is richer. The "coverage" charts below show how much of the daily needs can be covered by 300 grams of the food.
2
100 g
300 g
1 slice round - 12.3g
Magnesium
Magnesium
Calcium
Calcium
Potassium
Potassium
Iron
Iron
Copper
Copper
Zinc
Zinc
Phosphorus
Phosphorus
Sodium
Sodium
Manganese
Manganese
Selenium
Selenium
14%
4.5%
28%
59%
119%
80%
82%
227%
128%
171%
5
100 g
300 g
3 oz - 85g
Magnesium
Magnesium
Calcium
Calcium
Potassium
Potassium
Iron
Iron
Copper
Copper
Zinc
Zinc
Phosphorus
Phosphorus
Sodium
Sodium
Manganese
Manganese
Selenium
Selenium
16%
6.6%
30%
61%
24%
132%
91%
7.4%
1.2%
157%
Vitamin Comparison
Vitamin comparison score is based on the number of vitamins by which one or the other food is richer. The "coverage" charts below show how much of the daily needs can be covered by 300 grams of the food.
5
100 g
300 g
1 slice round - 12.3g
Vitamin C
Vit. C
Vitamin D
Vit. D
Vitamin A
Vit. A
Vitamin E
Vit. E
Vitamin B1
Vit. B1
Vitamin B2
Vit. B2
Vitamin B3
Vit. B3
Vitamin B5
Vit. B5
Vitamin B6
Vit. B6
Vitamin B12
Vit. B12
Vitamin K
Vit. K
Folate
Folate
0%
15%
0%
4.4%
92%
82%
113%
72%
106%
190%
8%
2.3%
4
100 g
300 g
3 oz - 85g
Vitamin C
Vit. C
Vitamin D
Vit. D
Vitamin A
Vit. A
Vitamin E
Vit. E
Vitamin B1
Vit. B1
Vitamin B2
Vit. B2
Vitamin B3
Vit. B3
Vitamin B5
Vit. B5
Vitamin B6
Vit. B6
Vitamin B12
Vit. B12
Vitamin K
Vit. K
Folate
Folate
0%
0%
0%
9%
20%
32%
131%
32%
135%
173%
4%
6%
All nutrients comparison - raw data values
Nutrient
DV% diff.
Sodium
1740mg
57mg
73%
Manganese
0.978mg
0.009mg
42%
Copper
0.357mg
0.073mg
32%
Vitamin B1
0.367mg
0.078mg
24%
Fats
25.9g
15.11g
17%
Zinc
2.93mg
4.85mg
17%
Vitamin B2
0.357mg
0.14mg
17%
Saturated fat
9.316g
5.951g
15%
Vitamin B5
1.201mg
0.527mg
13%
Polyunsaturated fat
2.529g
0.56g
13%
Monounsaturated fat
11.127g
6.298g
12%
Protein
21.85g
26.72g
10%
Vitamin B6
0.459mg
0.585mg
10%
Vitamin B3
6.053mg
6.978mg
6%
Vitamin B12
1.52µg
1.38µg
6%
Vitamin D*
41 IU
5%
Vitamin D
1µg
5%
Selenium
31.3µg
28.8µg
5%
Calories
336kcal
250kcal
4%
Cholesterol
89mg
79mg
3%
Phosphorus
191mg
213mg
3%
Vitamin E
0.22mg
0.45mg
2%
Choline
93.5mg
101.8mg
2%
Carbs
2.4g
0g
1%
Magnesium
19mg
23mg
1%
Calcium
15mg
22mg
1%
Potassium
316mg
340mg
1%
Iron
1.56mg
1.63mg
1%
Vitamin K
3.2µg
1.6µg
1%
Folate
3µg
8µg
1%
Protein per 100 calories
6.5g
11g
N/A
Calories per 10 g protein
154kcal
94kcal
N/A
Weight per 100 calories
30g
40g
N/A
Unsaturated / Saturated Fat ratio
1.5
1.2
N/A
Net carbs
2.4g
0g
N/A
Sugar
0.96g
0g
N/A
Trans fat
0.586g
N/A
Tryptophan
0.114mg
0.173mg
0%
Threonine
0.521mg
1.054mg
0%
Isoleucine
0.675mg
1.201mg
0%
Leucine
0.929mg
2.099mg
0%
Lysine
1.107mg
2.23mg
0%
Methionine
0.301mg
0.687mg
0%
Phenylalanine
0.481mg
1.042mg
0%
Valine
0.668mg
1.309mg
0%
Histidine
0.359mg
0.842mg
0%
Omega-3 - ALA
0.126g
N/A
Omega-6 - Eicosadienoic acid
0.084g
N/A
Omega-6 - Linoleic acid
2.104g
N/A
Macronutrient Comparison
Macronutrient breakdown side-by-side comparison
3
22%
26%
2%
45%
5%
Protein:
21.85 g
Fats:
25.9 g
Carbs:
2.4 g
Water:
45.19 g
Other:
4.66 g
2
27%
15%
58%
Protein:
26.72 g
Fats:
15.11 g
Carbs:
0 g
Water:
57.96 g
Other:
0.21 g
Contains
more
Fats Fats
+71.4%
Contains
more
Carbs Carbs
+∞%
Contains
more
Other Other
+2119%
Contains
more
Protein Protein
+22.3%
Contains
more
Water Water
+28.3%
Fat Type Comparison
Fat type breakdown side-by-side comparison
2
41%
48%
11%
Saturated fat:
Sat. Fat
9.316 g
Monounsaturated fat:
Mono. Fat
11.127 g
Polyunsaturated fat:
Poly. Fat
2.529 g
1
46%
49%
4%
Saturated fat:
Sat. Fat
5.951 g
Monounsaturated fat:
Mono. Fat
6.298 g
Polyunsaturated fat:
Poly. Fat
0.56 g
Contains
more
Mono. Fat Monounsaturated fat
+76.7%
Contains
more
Poly. Fat Polyunsaturated fat
+351.6%
Contains
less
Sat. Fat Saturated fat
-36.1%