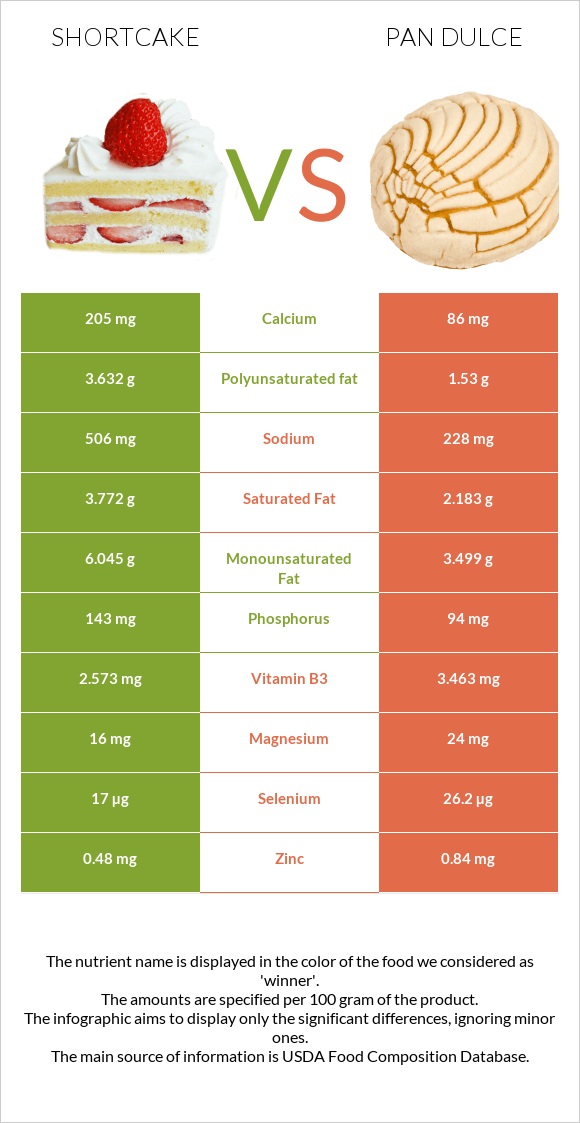
Differences between shortcake and pan dulce Shortcake has more calcium and phosphorus, while pan dulce has more selenium, folate, vitamin B5, manganese, and vitamin B3. Pan dulce's daily need coverage for selenium is 17% higher. Pan dulce contains 2 times less calcium than shortcake. Shortcake contains 205mg of calcium, while pan dulce contains 86mg. The amount of sodium in pan dulce is lower. The food types used in this comparison are Cake, shortcake, biscuit-type, prepared from recipe and Bread, pan dulce, sweet yeast bread .
Infographic
Mineral Comparison
Mineral comparison score is based on the number of minerals by which one or the other food is richer. The "coverage" charts below show how much of the daily needs can be covered by 300 grams of the food.
2
100 g
300 g
1 oz - 28.35g
Magnesium
Magnesium
Calcium
Calcium
Potassium
Potassium
Iron
Iron
Copper
Copper
Zinc
Zinc
Phosphorus
Phosphorus
Sodium
Sodium
Manganese
Manganese
Selenium
Selenium
11%
62%
9.4%
95%
25%
13%
61%
66%
43%
93%
7
100 g
300 g
1 slice (average weight of 1 slice) - 63g
Magnesium
Magnesium
Calcium
Calcium
Potassium
Potassium
Iron
Iron
Copper
Copper
Zinc
Zinc
Phosphorus
Phosphorus
Sodium
Sodium
Manganese
Manganese
Selenium
Selenium
17%
26%
9.1%
108%
40%
23%
40%
30%
60%
143%
Vitamin Comparison
Vitamin comparison score is based on the number of vitamins by which one or the other food is richer. The "coverage" charts below show how much of the daily needs can be covered by 300 grams of the food.
2
100 g
300 g
1 oz - 28.35g
Vitamin C
Vit. C
Vitamin D
Vit. D
Vitamin A
Vit. A
Vitamin E
Vit. E
Vitamin B1
Vit. B1
Vitamin B2
Vit. B2
Vitamin B3
Vit. B3
Vitamin B5
Vit. B5
Vitamin B6
Vit. B6
Vitamin B12
Vit. B12
Vitamin K
Vit. K
Folate
Folate
0.67%
0%
6%
0%
78%
63%
48%
15%
6.9%
8.8%
0%
40%
9
100 g
300 g
1 slice (average weight of 1 slice) - 63g
Vitamin C
Vit. C
Vitamin D
Vit. D
Vitamin A
Vit. A
Vitamin E
Vit. E
Vitamin B1
Vit. B1
Vitamin B2
Vit. B2
Vitamin B3
Vit. B3
Vitamin B5
Vit. B5
Vitamin B6
Vit. B6
Vitamin B12
Vit. B12
Vitamin K
Vit. K
Folate
Folate
4%
0%
1.7%
5.8%
94%
53%
65%
35%
13%
14%
4%
81%
All nutrients comparison - raw data values
Nutrient
DV% diff.
Selenium
17µg
26.2µg
17%
Starch
37.8g
16%
Folate
53µg
108µg
14%
Polyunsaturated fat
3.632g
1.53g
14%
Calcium
205mg
86mg
12%
Sodium
506mg
228mg
12%
Cholesterol
3mg
30mg
9%
Fiber
2.3g
9%
Protein
6.1g
9.42g
7%
Phosphorus
143mg
94mg
7%
Vitamin B5
0.248mg
0.59mg
7%
Saturated fat
3.772g
2.183g
7%
Manganese
0.33mg
0.46mg
6%
Vitamin B1
0.311mg
0.377mg
6%
Vitamin B3
2.573mg
3.463mg
6%
Monounsaturated fat
6.045g
3.499g
6%
Copper
0.076mg
0.121mg
5%
Choline
29.1mg
5%
Fructose
4.05g
5%
Fats
14.2g
11.58g
4%
Iron
2.54mg
2.87mg
4%
Carbs
48.5g
56.38g
3%
Zinc
0.48mg
0.84mg
3%
Vitamin B2
0.272mg
0.23mg
3%
Magnesium
16mg
24mg
2%
Vitamin E
0.29mg
2%
Vitamin B6
0.03mg
0.057mg
2%
Vitamin B12
0.07µg
0.11µg
2%
Calories
346kcal
367kcal
1%
Vitamin C
0.2mg
1.2mg
1%
Vitamin A
18µg
5µg
1%
Vitamin K
1.6µg
1%
Protein per 100 calories
1.8g
2.6g
N/A
Calories per 10 g protein
567kcal
390kcal
N/A
Weight per 100 calories
29g
27g
N/A
Unsaturated / Saturated Fat ratio
2.6
2.3
N/A
Net carbs
48.5g
54.08g
N/A
Potassium
106mg
103mg
0%
Sugar
12.5g
N/A
Trans fat
1.103g
N/A
Tryptophan
0.076mg
0%
Threonine
0.184mg
0%
Isoleucine
0.238mg
0%
Leucine
0.449mg
0%
Lysine
0.197mg
0%
Methionine
0.115mg
0%
Phenylalanine
0.302mg
0%
Valine
0.273mg
0%
Histidine
0.14mg
0%
Omega-3 - ALA
0.066g
N/A
Omega-3 - DPA
0g
0.001g
N/A
Omega-3 - Eicosatrienoic acid
0.002g
N/A
Omega-6 - Gamma-linoleic acid
0.001g
N/A
Omega-6 - Dihomo-gamma-linoleic acid
0.002g
N/A
Omega-6 - Eicosadienoic acid
0.009g
N/A
Omega-6 - Linoleic acid
1.21g
N/A
Macronutrient Comparison
Macronutrient breakdown side-by-side comparison
3
6%
14%
49%
28%
3%
Protein:
6.1 g
Fats:
14.2 g
Carbs:
48.5 g
Water:
28.4 g
Other:
2.8 g
2
9%
12%
56%
22%
Protein:
9.42 g
Fats:
11.58 g
Carbs:
56.38 g
Water:
21.54 g
Other:
1.08 g
Contains
more
Fats Fats
+22.6%
Contains
more
Water Water
+31.8%
Contains
more
Other Other
+159.3%
Contains
more
Protein Protein
+54.4%
Contains
more
Carbs Carbs
+16.2%
Fat Type Comparison
Fat type breakdown side-by-side comparison
2
28%
45%
27%
Saturated fat:
Sat. Fat
3.772 g
Monounsaturated fat:
Mono. Fat
6.045 g
Polyunsaturated fat:
Poly. Fat
3.632 g
1
30%
49%
21%
Saturated fat:
Sat. Fat
2.183 g
Monounsaturated fat:
Mono. Fat
3.499 g
Polyunsaturated fat:
Poly. Fat
1.53 g
Contains
more
Mono. Fat Monounsaturated fat
+72.8%
Contains
more
Poly. Fat Polyunsaturated fat
+137.4%
Contains
less
Sat. Fat Saturated fat
-42.1%