Infographic
Mineral Comparison
Mineral comparison score is based on the number of minerals by which one or the other food is richer. The "coverage" charts below show how much of the daily needs can be covered by 300 grams of the food.
4
100 g
300 g
1 bar 1.4 oz - 39g
Magnesium
Magnesium
Calcium
Calcium
Potassium
Potassium
Iron
Iron
Copper
Copper
Zinc
Zinc
Phosphorus
Phosphorus
Sodium
Sodium
Manganese
Manganese
Selenium
Selenium
7.1%
9%
14%
21%
13%
4.6%
26%
41%
0%
0%
4
100 g
300 g
1 package 1.375 oz - 39g 1 serving 0.25 cup - 41g 1 serving fun size - 48g
Magnesium
Magnesium
Calcium
Calcium
Potassium
Potassium
Iron
Iron
Copper
Copper
Zinc
Zinc
Phosphorus
Phosphorus
Sodium
Sodium
Manganese
Manganese
Selenium
Selenium
0%
27%
44%
41%
0%
0%
0%
4.7%
0%
0%
Vitamin Comparison
Vitamin comparison score is based on the number of vitamins by which one or the other food is richer. The "coverage" charts below show how much of the daily needs can be covered by 300 grams of the food.
12
100 g
300 g
1 bar 1.4 oz - 39g
Vitamin C
Vit. C
Vitamin D
Vit. D
Vitamin A
Vit. A
Vitamin E
Vit. E
Vitamin B1
Vit. B1
Vitamin B2
Vit. B2
Vitamin B3
Vit. B3
Vitamin B5
Vit. B5
Vitamin B6
Vit. B6
Vitamin B12
Vit. B12
Vitamin K
Vit. K
Folate
Folate
1.7%
1.5%
20%
12%
5%
23%
2.4%
2.4%
5.1%
26%
22%
1.5%
0
100 g
300 g
1 package 1.375 oz - 39g 1 serving 0.25 cup - 41g 1 serving fun size - 48g
Vitamin C
Vit. C
Vitamin D
Vit. D
Vitamin A
Vit. A
Vitamin E
Vit. E
Vitamin B1
Vit. B1
Vitamin B2
Vit. B2
Vitamin B3
Vit. B3
Vitamin B5
Vit. B5
Vitamin B6
Vit. B6
Vitamin B12
Vit. B12
Vitamin K
Vit. K
Folate
Folate
1%
0%
0%
0%
0%
0%
0%
0%
0%
0%
0%
0%
All nutrients comparison - raw data values
Nutrient
DV% diff.
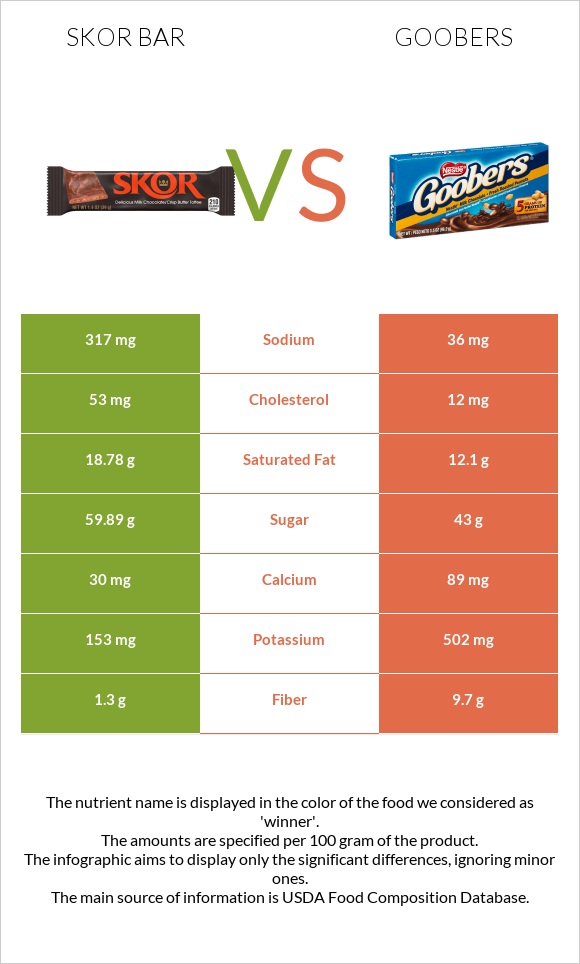
Fiber
1.3g
9.7g
34%
Saturated fat
18.78g
12.1g
30%
Monounsaturated fat
9.714g
24%
Cholesterol
53mg
12mg
14%
Protein
3.13g
9.7g
13%
Sodium
317mg
36mg
12%
Potassium
153mg
502mg
10%
Phosphorus
61mg
9%
Vitamin B12
0.21µg
9%
Vitamin B2
0.1mg
8%
Polyunsaturated fat
1.191g
8%
Iron
0.57mg
1.1mg
7%
Vitamin A
61µg
7%
Vitamin K
8.6µg
7%
Fats
30.37g
34g
6%
Calcium
30mg
89mg
6%
Carbs
63.73g
53g
4%
Copper
0.04mg
4%
Vitamin E
0.58mg
4%
Caffeine
10mg
3%
Magnesium
10mg
2%
Zinc
0.17mg
2%
Vitamin B1
0.02mg
2%
Vitamin B6
0.022mg
2%
Calories
541kcal
512kcal
1%
Vitamin D
0.1µg
1%
Vitamin B3
0.13mg
1%
Vitamin B5
0.04mg
1%
Folate
2µg
1%
Choline
3.1mg
1%
Protein per 100 calories
0.58g
1.9g
N/A
Calories per 10 g protein
1728kcal
528kcal
N/A
Weight per 100 calories
18g
20g
N/A
Unsaturated / Saturated Fat ratio
0.58
0
N/A
Vitamin C
0.5mg
0.3mg
0%
Net carbs
62.43g
43.3g
N/A
Vitamin D*
3 IU
0%
Sugar
59.89g
43g
N/A
Trans fat
0.07g
N/A
Macronutrient Comparison
Macronutrient breakdown side-by-side comparison
1
3%
30%
64%
Protein:
3.13 g
Fats:
30.37 g
Carbs:
63.73 g
Water:
1.57 g
Other:
1.2 g
4
10%
34%
53%
2%
Protein:
9.7 g
Fats:
34 g
Carbs:
53 g
Water:
1.9 g
Other:
1.4 g
Contains
more
Carbs Carbs
+20.2%
Contains
more
Protein Protein
+209.9%
Contains
more
Fats Fats
+12%
Contains
more
Water Water
+21%
Contains
more
Other Other
+16.7%
Fat Type Comparison
Fat type breakdown side-by-side comparison
2
63%
33%
4%
Saturated fat:
Sat. Fat
18.78 g
Monounsaturated fat:
Mono. Fat
9.714 g
Polyunsaturated fat:
Poly. Fat
1.191 g
1
100%
Saturated fat:
Sat. Fat
12.1 g
Monounsaturated fat:
Mono. Fat
0 g
Polyunsaturated fat:
Poly. Fat
0 g
Contains
more
Mono. Fat Monounsaturated fat
+∞%
Contains
more
Poly. Fat Polyunsaturated fat
+∞%
Contains
less
Sat. Fat Saturated fat
-35.6%