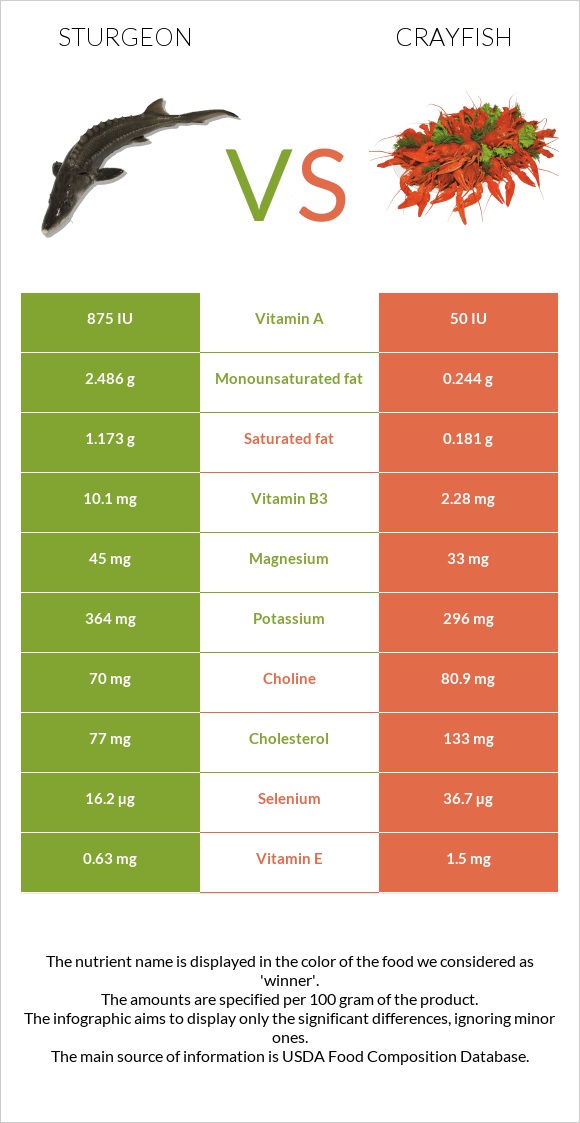
Differences between sturgeon and crayfish Sturgeon has more vitamin D*, vitamin B3, vitamin A, vitamin B12, and vitamin B6, while crayfish has more copper, selenium, manganese, and zinc. Crayfish's daily need coverage for copper is 70% higher. The amount of cholesterol in sturgeon is lower. The food types used in this comparison are Fish, sturgeon, mixed species, cooked, dry heat and Crustaceans, crayfish, mixed species, wild, cooked, moist heat .
Infographic
Mineral Comparison
Mineral comparison score is based on the number of minerals by which one or the other food is richer. The "coverage" charts below show how much of the daily needs can be covered by 300 grams of the food.
3
100 g
300 g
1 cubic inch, boneless - 17g 1 oz, boneless - 28.35g 3 oz - 85g 1 cup, cooked - 136g 1 piece (4-1/2" x 2-1/8" x 7/8") - 145g
Magnesium
Magnesium
Calcium
Calcium
Potassium
Potassium
Iron
Iron
Copper
Copper
Zinc
Zinc
Phosphorus
Phosphorus
Sodium
Sodium
Manganese
Manganese
Selenium
Selenium
32%
5.1%
32%
34%
18%
15%
116%
9%
3.9%
88%
5
100 g
300 g
3 oz - 85g
Magnesium
Magnesium
Calcium
Calcium
Potassium
Potassium
Iron
Iron
Copper
Copper
Zinc
Zinc
Phosphorus
Phosphorus
Sodium
Sodium
Manganese
Manganese
Selenium
Selenium
24%
18%
26%
31%
228%
48%
116%
12%
68%
200%
Vitamin Comparison
Vitamin comparison score is based on the number of vitamins by which one or the other food is richer. The "coverage" charts below show how much of the daily needs can be covered by 300 grams of the food.
7
100 g
300 g
1 cubic inch, boneless - 17g 1 oz, boneless - 28.35g 3 oz - 85g 1 cup, cooked - 136g 1 piece (4-1/2" x 2-1/8" x 7/8") - 145g
Vitamin C
Vit. C
Vitamin D
Vit. D
Vitamin A
Vit. A
Vitamin E
Vit. E
Vitamin B1
Vit. B1
Vitamin B2
Vit. B2
Vitamin B3
Vit. B3
Vitamin B5
Vit. B5
Vitamin B6
Vit. B6
Vitamin B12
Vit. B12
Vitamin K
Vit. K
Folate
Folate
0%
194%
88%
13%
20%
21%
189%
52%
53%
313%
0.25%
13%
3
100 g
300 g
3 oz - 85g
Vitamin C
Vit. C
Vitamin D
Vit. D
Vitamin A
Vit. A
Vitamin E
Vit. E
Vitamin B1
Vit. B1
Vitamin B2
Vit. B2
Vitamin B3
Vit. B3
Vitamin B5
Vit. B5
Vitamin B6
Vit. B6
Vitamin B12
Vit. B12
Vitamin K
Vit. K
Folate
Folate
3%
0%
5%
30%
13%
20%
43%
35%
18%
269%
0.25%
33%
All nutrients comparison - raw data values
Nutrient
DV% diff.
Copper
0.053mg
0.685mg
70%
Vitamin D
12.9µg
0µg
65%
Vitamin D*
515 IU
0 IU
64%
Vitamin B3
10.1mg
2.28mg
49%
Selenium
16.2µg
36.7µg
37%
Vitamin A
263µg
15µg
28%
Manganese
0.03mg
0.522mg
21%
Cholesterol
77mg
133mg
19%
Vitamin B12
2.5µg
2.15µg
15%
Vitamin B6
0.23mg
0.076mg
12%
Zinc
0.54mg
1.76mg
11%
Protein
20.7g
16.77g
8%
Folate
17µg
44µg
7%
Fats
5.18g
1.2g
6%
Vitamin E
0.63mg
1.5mg
6%
Vitamin B5
0.87mg
0.58mg
6%
Monounsaturated fat
2.486g
0.244g
6%
Saturated fat
1.173g
0.181g
5%
Calcium
17mg
60mg
4%
Calories
135kcal
82kcal
3%
Magnesium
45mg
33mg
3%
Vitamin B1
0.08mg
0.05mg
3%
Polyunsaturated fat
0.885g
0.367g
3%
Potassium
364mg
296mg
2%
Choline
70mg
80.9mg
2%
Vitamin C
0mg
0.9mg
1%
Iron
0.9mg
0.83mg
1%
Sodium
69mg
94mg
1%
Protein per 100 calories
15g
20g
N/A
Calories per 10 g protein
65kcal
49kcal
N/A
Weight per 100 calories
74g
122g
N/A
Unsaturated / Saturated Fat ratio
2.9
3.4
N/A
Phosphorus
271mg
270mg
0%
Vitamin B2
0.09mg
0.085mg
0%
Vitamin K
0.1µg
0.1µg
0%
Tryptophan
0.232mg
0.234mg
0%
Threonine
0.907mg
0.676mg
0%
Isoleucine
0.954mg
0.811mg
0%
Leucine
1.682mg
1.329mg
0%
Lysine
1.901mg
1.457mg
0%
Methionine
0.613mg
0.472mg
0%
Phenylalanine
0.808mg
0.706mg
0%
Valine
1.066mg
0.786mg
0%
Histidine
0.609mg
0.341mg
0%
Omega-3 - EPA
0.249g
0.119g
N/A
Omega-3 - DHA
0.119g
0.047g
N/A
Omega-3 - DPA
0.058g
0g
N/A
Macronutrient Comparison
Macronutrient breakdown side-by-side comparison
3
21%
5%
70%
4%
Protein:
20.7 g
Fats:
5.18 g
Carbs:
0 g
Water:
69.94 g
Other:
4.18 g
1
17%
79%
3%
Protein:
16.77 g
Fats:
1.2 g
Carbs:
0 g
Water:
79.37 g
Other:
2.66 g
Contains
more
Protein Protein
+23.4%
Contains
more
Fats Fats
+331.7%
Contains
more
Other Other
+57.1%
Contains
more
Water Water
+13.5%
Fat Type Comparison
Fat type breakdown side-by-side comparison
2
26%
55%
19%
Saturated fat:
Sat. Fat
1.173 g
Monounsaturated fat:
Mono. Fat
2.486 g
Polyunsaturated fat:
Poly. Fat
0.885 g
1
23%
31%
46%
Saturated fat:
Sat. Fat
0.181 g
Monounsaturated fat:
Mono. Fat
0.244 g
Polyunsaturated fat:
Poly. Fat
0.367 g
Contains
more
Mono. Fat Monounsaturated fat
+918.9%
Contains
more
Poly. Fat Polyunsaturated fat
+141.1%
Contains
less
Sat. Fat Saturated fat
-84.6%