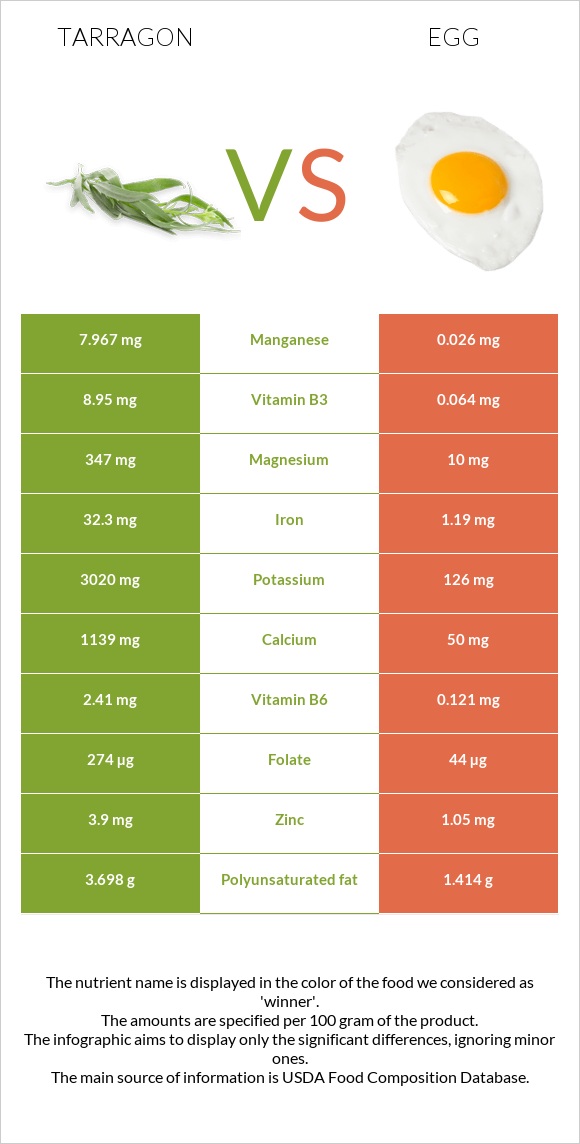
Significant differences between tarragon and eggs Tarragon has more iron, manganese, vitamin B6, calcium, potassium, magnesium, vitamin A, and vitamin B2; however, eggs are richer in copper. Tarragon covers your daily iron needs 389% more than eggs. Eggs have 306 times less manganese than tarragon. Tarragon has 7.967mg of manganese, while eggs have 0.026mg. Specific food types used in this comparison are Spices, tarragon, dried and Egg, whole, cooked, hard-boiled .
Infographic
Mineral Comparison
Mineral comparison score is based on the number of minerals by which one or the other food is richer. The "coverage" charts below show how much of the daily needs can be covered by 300 grams of the food.
8
100 g
300 g
0.25 tsp - 0.5g 1 tsp, ground - 1.6g 1 tbsp, leaves - 1.8g 1 tbsp, ground - 4.8g
Magnesium
Magnesium
Calcium
Calcium
Potassium
Potassium
Iron
Iron
Copper
Copper
Zinc
Zinc
Phosphorus
Phosphorus
Sodium
Sodium
Manganese
Manganese
Selenium
Selenium
248%
342%
266%
1211%
226%
106%
134%
8.1%
1039%
24%
2
100 g
300 g
1 tbsp - 8.5g 1 large - 50g 1 cup, chopped - 136g
Magnesium
Magnesium
Calcium
Calcium
Potassium
Potassium
Iron
Iron
Copper
Copper
Zinc
Zinc
Phosphorus
Phosphorus
Sodium
Sodium
Manganese
Manganese
Selenium
Selenium
7.1%
15%
11%
45%
667%
29%
74%
16%
3.4%
168%
Vitamin Comparison
Vitamin comparison score is based on the number of vitamins by which one or the other food is richer. The "coverage" charts below show how much of the daily needs can be covered by 300 grams of the food.
7
100 g
300 g
0.25 tsp - 0.5g 1 tsp, ground - 1.6g 1 tbsp, leaves - 1.8g 1 tbsp, ground - 4.8g
Vitamin C
Vit. C
Vitamin D
Vit. D
Vitamin A
Vit. A
Vitamin E
Vit. E
Vitamin B1
Vit. B1
Vitamin B2
Vit. B2
Vitamin B3
Vit. B3
Vitamin B5
Vit. B5
Vitamin B6
Vit. B6
Vitamin B12
Vit. B12
Vitamin K
Vit. K
Folate
Folate
167%
0%
70%
0%
63%
309%
168%
0%
556%
0%
0%
206%
5
100 g
300 g
1 tbsp - 8.5g 1 large - 50g 1 cup, chopped - 136g
Vitamin C
Vit. C
Vitamin D
Vit. D
Vitamin A
Vit. A
Vitamin E
Vit. E
Vitamin B1
Vit. B1
Vitamin B2
Vit. B2
Vitamin B3
Vit. B3
Vitamin B5
Vit. B5
Vitamin B6
Vit. B6
Vitamin B12
Vit. B12
Vitamin K
Vit. K
Folate
Folate
0%
33%
50%
21%
17%
118%
1.2%
84%
28%
139%
0.75%
33%
All nutrients comparison - raw data values
Nutrient
DV% diff.
Iron
32.3mg
1.19mg
389%
Manganese
7.967mg
0.026mg
345%
Vitamin B6
2.41mg
0.121mg
176%
Copper
0.677mg
2mg
147%
Cholesterol
0mg
373mg
124%
Calcium
1139mg
50mg
109%
Potassium
3020mg
126mg
85%
Magnesium
347mg
10mg
80%
Vitamin B2
1.339mg
0.513mg
64%
Folate
274µg
44µg
58%
Vitamin C
50mg
0mg
56%
Vitamin B3
8.95mg
0.064mg
56%
Choline
293.8mg
53%
Selenium
4.4µg
30.8µg
48%
Vitamin B12
0µg
1.11µg
46%
Fiber
7.4g
0g
30%
Vitamin B5
1.398mg
28%
Zinc
3.9mg
1.05mg
26%
Protein
22.77g
12.58g
20%
Phosphorus
313mg
172mg
20%
Carbs
50.22g
1.12g
16%
Vitamin B1
0.251mg
0.066mg
15%
Polyunsaturated fat
3.698g
1.414g
15%
Vitamin D*
0 IU
87 IU
11%
Vitamin D
0µg
2.2µg
11%
Monounsaturated fat
0.474g
4.077g
9%
Calories
295kcal
155kcal
7%
Vitamin A
210µg
149µg
7%
Vitamin E
1.03mg
7%
Saturated fat
1.881g
3.267g
6%
Fats
7.24g
10.61g
5%
Sodium
62mg
124mg
3%
Protein per 100 calories
7.7g
8.1g
N/A
Calories per 10 g protein
130kcal
123kcal
N/A
Weight per 100 calories
34g
65g
N/A
Unsaturated / Saturated Fat ratio
2.2
1.7
N/A
Net carbs
42.82g
1.12g
N/A
Sugar
1.12g
N/A
Vitamin K
0.3µg
0%
Tryptophan
0.153mg
0%
Threonine
0.604mg
0%
Isoleucine
0.686mg
0%
Leucine
1.075mg
0%
Lysine
0.904mg
0%
Methionine
0.392mg
0%
Phenylalanine
0.668mg
0%
Valine
0.767mg
0%
Histidine
0.298mg
0%
Omega-3 - EPA
0g
0.005g
N/A
Omega-3 - DHA
0g
0.038g
N/A
Macronutrient Comparison
Macronutrient breakdown side-by-side comparison
3
23%
7%
50%
8%
12%
Protein:
22.77 g
Fats:
7.24 g
Carbs:
50.22 g
Water:
7.74 g
Other:
12.03 g
2
13%
11%
75%
Protein:
12.58 g
Fats:
10.61 g
Carbs:
1.12 g
Water:
74.62 g
Other:
1.07 g
Contains
more
Protein Protein
+81%
Contains
more
Carbs Carbs
+4383.9%
Contains
more
Other Other
+1024.3%
Contains
more
Fats Fats
+46.5%
Contains
more
Water Water
+864.1%
Fat Type Comparison
Fat type breakdown side-by-side comparison
2
31%
8%
61%
Saturated fat:
Sat. Fat
1.881 g
Monounsaturated fat:
Mono. Fat
0.474 g
Polyunsaturated fat:
Poly. Fat
3.698 g
1
37%
47%
16%
Saturated fat:
Sat. Fat
3.267 g
Monounsaturated fat:
Mono. Fat
4.077 g
Polyunsaturated fat:
Poly. Fat
1.414 g
Contains
less
Sat. Fat Saturated fat
-42.4%
Contains
more
Poly. Fat Polyunsaturated fat
+161.5%
Contains
more
Mono. Fat Monounsaturated fat
+760.1%