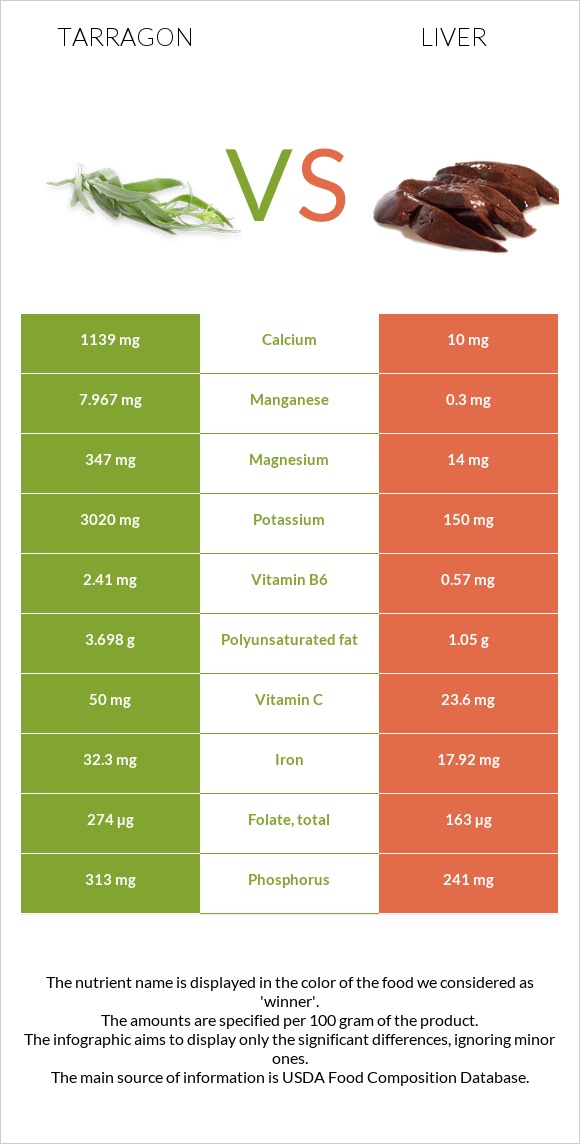
Important differences between tarragon and liver Tarragon has more manganese, iron, vitamin B6, calcium, potassium, and magnesium; however, liver is richer in vitamin B12, vitamin A, and selenium. Liver's daily need coverage for vitamin B12 is 778% more. Tarragon contains 114 times more calcium than liver. Tarragon contains 1139mg of calcium, while liver contains 10mg. The food varieties used in the comparison are Spices, tarragon, dried and Pork, fresh, variety meats, and by-products, liver, cooked, braised .
Infographic
Mineral Comparison
Mineral comparison score is based on the number of minerals by which one or the other food is richer. The "coverage" charts below show how much of the daily needs can be covered by 300 grams of the food.
6
100 g
300 g
0.25 tsp - 0.5g 1 tsp, ground - 1.6g 1 tbsp, leaves - 1.8g 1 tbsp, ground - 4.8g
Magnesium
Magnesium
Calcium
Calcium
Potassium
Potassium
Iron
Iron
Copper
Copper
Zinc
Zinc
Phosphorus
Phosphorus
Sodium
Sodium
Manganese
Manganese
Selenium
Selenium
248%
342%
266%
1211%
226%
106%
134%
8.1%
1039%
24%
3
100 g
300 g
3 oz - 85g
Magnesium
Magnesium
Calcium
Calcium
Potassium
Potassium
Iron
Iron
Copper
Copper
Zinc
Zinc
Phosphorus
Phosphorus
Sodium
Sodium
Manganese
Manganese
Selenium
Selenium
10%
3%
13%
672%
211%
183%
103%
6.4%
39%
368%
Vitamin Comparison
Vitamin comparison score is based on the number of vitamins by which one or the other food is richer. The "coverage" charts below show how much of the daily needs can be covered by 300 grams of the food.
3
100 g
300 g
0.25 tsp - 0.5g 1 tsp, ground - 1.6g 1 tbsp, leaves - 1.8g 1 tbsp, ground - 4.8g
Vitamin C
Vit. C
Vitamin D
Vit. D
Vitamin A
Vit. A
Vitamin E
Vit. E
Vitamin B1
Vit. B1
Vitamin B2
Vit. B2
Vitamin B3
Vit. B3
Vitamin B5
Vit. B5
Vitamin B6
Vit. B6
Vitamin B12
Vit. B12
Vitamin K
Vit. K
Folate
Folate
167%
0%
70%
0%
63%
309%
168%
0%
556%
0%
0%
206%
4
100 g
300 g
3 oz - 85g
Vitamin C
Vit. C
Vitamin D
Vit. D
Vitamin A
Vit. A
Vitamin E
Vit. E
Vitamin B1
Vit. B1
Vitamin B2
Vit. B2
Vitamin B3
Vit. B3
Vitamin B5
Vit. B5
Vitamin B6
Vit. B6
Vitamin B12
Vit. B12
Vitamin K
Vit. K
Folate
Folate
79%
0%
1802%
0%
65%
507%
158%
286%
132%
2334%
0%
122%
All nutrients comparison - raw data values
Nutrient
DV% diff.
Vitamin B12
0µg
18.67µg
778%
Vitamin A
210µg
5405µg
577%
Manganese
7.967mg
0.3mg
333%
Iron
32.3mg
17.92mg
180%
Vitamin B6
2.41mg
0.57mg
142%
Cholesterol
0mg
355mg
118%
Selenium
4.4µg
67.5µg
115%
Calcium
1139mg
10mg
113%
Vitamin B5
4.774mg
95%
Potassium
3020mg
150mg
84%
Magnesium
347mg
14mg
79%
Vitamin B2
1.339mg
2.196mg
66%
Fiber
7.4g
0g
30%
Vitamin C
50mg
23.6mg
29%
Folate
274µg
163µg
28%
Zinc
3.9mg
6.72mg
26%
Polyunsaturated fat
3.698g
1.05g
18%
Carbs
50.22g
3.76g
15%
Phosphorus
313mg
241mg
10%
Calories
295kcal
165kcal
7%
Protein
22.77g
26.02g
7%
Copper
0.677mg
0.634mg
5%
Fats
7.24g
4.4g
4%
Vitamin B3
8.95mg
8.435mg
3%
Saturated fat
1.881g
1.41g
2%
Sodium
62mg
49mg
1%
Vitamin B1
0.251mg
0.258mg
1%
Protein per 100 calories
7.7g
16g
N/A
Calories per 10 g protein
130kcal
63kcal
N/A
Weight per 100 calories
34g
61g
N/A
Unsaturated / Saturated Fat ratio
2.2
1.2
N/A
Net carbs
42.82g
3.76g
N/A
Monounsaturated fat
0.474g
0.63g
0%
Tryptophan
0.366mg
0%
Threonine
1.107mg
0%
Isoleucine
1.32mg
0%
Leucine
2.319mg
0%
Lysine
2.007mg
0%
Methionine
0.645mg
0%
Phenylalanine
1.274mg
0%
Valine
1.607mg
0%
Histidine
0.708mg
0%
Omega-3 - DHA
0g
0.03g
N/A
Omega-3 - DPA
0g
0.04g
N/A
Macronutrient Comparison
Macronutrient breakdown side-by-side comparison
3
23%
7%
50%
8%
12%
Protein:
22.77 g
Fats:
7.24 g
Carbs:
50.22 g
Water:
7.74 g
Other:
12.03 g
2
26%
4%
4%
64%
Protein:
26.02 g
Fats:
4.4 g
Carbs:
3.76 g
Water:
64.32 g
Other:
1.5 g
Contains
more
Fats Fats
+64.5%
Contains
more
Carbs Carbs
+1235.6%
Contains
more
Other Other
+702%
Contains
more
Protein Protein
+14.3%
Contains
more
Water Water
+731%
Fat Type Comparison
Fat type breakdown side-by-side comparison
1
31%
8%
61%
Saturated fat:
Sat. Fat
1.881 g
Monounsaturated fat:
Mono. Fat
0.474 g
Polyunsaturated fat:
Poly. Fat
3.698 g
2
46%
20%
34%
Saturated fat:
Sat. Fat
1.41 g
Monounsaturated fat:
Mono. Fat
0.63 g
Polyunsaturated fat:
Poly. Fat
1.05 g
Contains
more
Poly. Fat Polyunsaturated fat
+252.2%
Contains
less
Sat. Fat Saturated fat
-25%
Contains
more
Mono. Fat Monounsaturated fat
+32.9%