Tilapia vs. Rockfish — Health Impact and Nutrition Comparison


Summary
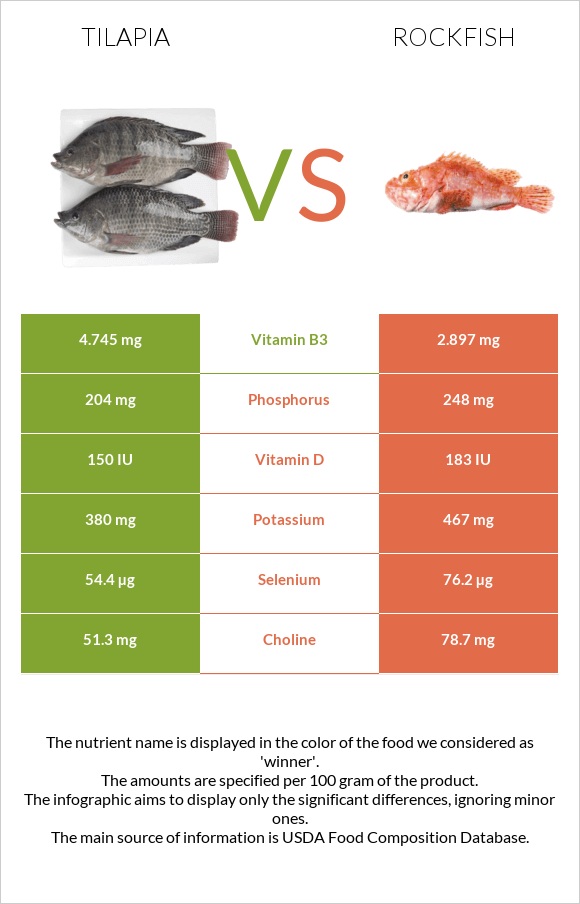
In comparison to tilapia, rockfish have greater concentrations of selenium, vitamin B2, vitamin B6, phosphorus, and vitamin D. Particularly compared to tilapia; rockfish provide 40% more of the daily need for selenium. With 0.226 mg compared to 0.073 mg in Tilapia, Rockfish has three times the amount of Vitamin B2 as Tilapia. Conversely, Tilapia has greater concentrations of vitamins B3, B12, B1, and B5.
Introduction
In this post, we'll contrast prepared versions of different fish species, highlighting the distinctions between them in terms of their nutritional value and potential effects on health.
Actual Differences
Rockfish, also known as the Atlantic striped bass, exhibit a silver look with a white belly, whereas tilapia, a freshwater fish from the Cichlidae family, stands out with its deep body that is black, crimson, or gold, with long dorsal fins.
Tilapia has a mild, non-fishy flavor that is a little bit sweet, whereas rockfish has a buttery, non-fishy flavor that is delicious.
In contrast to rockfish, which is traditionally eaten steamed, broiled, or roasted, tilapia may be cooked in a variety of ways, including sealing, poaching, steaming, grilling, baking, or smoking. Compared to diverse rockfish species, including Canary Rockfish, Copper Rockfish, and Widow Rockfish, tilapia's silvery look is in stark contrast to their varying shades of silver, greyish blue, or olive green.
Nutrition
The composition of rockfish and tilapia in terms of macronutrients, minerals, and vitamins will be covered in this section of the text. They are both healthy fish that have no carbohydrates at all.
Macronutrient Comparison
Contains
more
ProteinProtein
+17.6%
Contains
more
FatsFats
+63.6%
Contains
more
OtherOther
+∞%
Calories
Rockfish has fewer calories per serving than tilapia. Tilapia has 128 kcal, whereas rockfish has 109 kcal.
Protei
Rockfish are somewhat lower in protein than tilapia. Tilapia has 26.15g of protein per 100g serving, but rockfish only have 22.2g.
They both provide healthy amounts of vital amino acids.
Fats
The quantity of fat in tilapia and rockfish per 100g is insignificant. Tilapia has a slightly greater fat content of 2.65g compared to rockfish's 1.62g.
Tilapia has 0.94g of saturated fat, while rockfish has 0.42g. Additionally, compared to rockfish, which has 0.13g and 0.005g of omega-3 fatty acids, respectively, rockfish has greater concentrations of DHA (0.238g) and EPA (0.107g). Tilapia, on the other hand, has more Omega-3 DPA (0.06g). Tilapia has higher monounsaturated fat (0.466g) and polyunsaturated fat (0.485g) than Rockfish (0.955g and 0.6g, respectively) in terms of unsaturated fats. Omega-6 Eicosadienoic acid is also somewhat more abundant in tilapia (0.015g). Omega-3 ALA levels in each fish are comparable, with tilapia having 0.045g.
Fat Type Comparison
Contains
more
Mono. FatMonounsaturated fat
+104.9%
Contains
more
Poly. FatPolyunsaturated fat
+23.7%
Contains
less
Sat. FatSaturated fat
-55.3%
Vitamins
Tilapia doesn't have any vitamin A content, although rockfish does. Additionally, vitamin D, vitamin B2, and vitamin B6 levels in rockfish are somewhat higher.
When compared to rockfish, tilapia is higher in vitamin E, vitamin B1, vitamin B3, vitamin B5, and folate.
Vitamin Comparison
Contains
more
Vitamin EVitamin E
+79.5%
Contains
more
Vitamin B1Vitamin B1
+244.4%
Contains
more
Vitamin B3Vitamin B3
+63.8%
Contains
more
Vitamin B5Vitamin B5
+64.4%
Contains
more
Vitamin B12Vitamin B12
+17%
Contains
more
Vitamin KVitamin K
+∞%
Contains
more
Vitamin AVitamin A
+∞%
Contains
more
Vitamin DVitamin D
+24.3%
Contains
more
Vitamin B2Vitamin B2
+209.6%
Contains
more
Vitamin B6Vitamin B6
+95.9%
Contains
more
FolateFolate
+66.7%
Minerals
Rockfish contain a tiny bit more calcium, iron, phosphorus, potassium, and selenium compared to tilapia.
Tilapia has lower levels of magnesium, zinc, copper, and sodium than rockfish.
Mineral Comparison
Contains
more
IronIron
+91.7%
Contains
more
CopperCopper
+82.9%
Contains
less
SodiumSodium
-37.1%
Contains
more
ManganeseManganese
+184.6%
Contains
more
CalciumCalcium
+21.4%
Contains
more
PotassiumPotassium
+22.9%
Contains
more
PhosphorusPhosphorus
+21.6%
Contains
more
SeleniumSelenium
+40.1%
Glycemic Index
Rockfish and tilapia both have a glycemic index of zero. For more GI values, see our glycemic index chart.
Health Impact
Cardiovascular Health
Rockfish and tilapia are good sources of omega-3 fatty acids, which are essential for people with metabolic syndrome and coronary artery disease because these fatty acids may help improve lipid profiles, lowering LDL (bad cholesterol) levels in the blood (1.2.3).
The combination of omega-3 fats and statins (such as Rosuvastatin, Atorvastatin, etc.) has been shown to be a successful and well-tolerated treatment for dyslipidemia. Patients who have had a recent myocardial infarction may also benefit from this combination (4).
Protein hydrolysates obtained from tilapia byproducts, such as skin and frame, exhibited varying levels of in vitro ACE and renin-inhibitory activity, which is important to the pathogenesis of arterial hypertension (5.6).
Consuming fatty fish twice a week is important for maintaining a healthy heart, and the American Heart Association strongly recommends it. Make sure to include this nutrient-dense food in your diet to help prevent heart disease and promote overall well-being (7).
Downsides and Risk
Tilapia and rockfish are categorized as foods with moderate mercury content. While healthy middle-aged people are not adversely affected by mercury, children, teens, and pregnant women may be (8). It is advised to minimize fish consumption, particularly that of rockfish and tilapia, to prevent mercury poisoning, especially for sensitive groups including children, teenagers, and expectant women.
It is important to be informed that tilapia is regularly farmed using harmful chemicals, which are against the law and is commonly fed animal waste. It might include the potential carcinogen dioxin (9).
Sources.
- https://www.tandfonline.com/doi/abs/10.1080/10498850802581294
- https://pubmed.ncbi.nlm.nih.gov/19757249/
- https://www.ahajournals.org/doi/abs/10.1161/01.ATV.4.3.270
- https://pubmed.ncbi.nlm.nih.gov/34049675/
- https://www.tandfonline.com/doi/10.1080/16546628.2017.1391666
- https://www.nature.com/articles/1000391
- https://www.heart.org/en/healthy-living/healthy-eating/eat-smart/fats/fish-and-omega-3-fatty-acids
- https://www.ncbi.nlm.nih.gov/pmc/articles/PMC2954077/
- https://pubmed.ncbi.nlm.nih.gov/14623487/.

Infographic
All nutrients comparison - raw data values
| Nutrient | |
|
DV% diff. |
| Selenium | 54.4µg | 76.2µg | 40% |
| Vitamin B2 | 0.073mg | 0.226mg | 12% |
| Vitamin B3 | 4.745mg | 2.897mg | 12% |
| Vitamin B12 | 1.86µg | 1.59µg | 11% |
| Vitamin B6 | 0.123mg | 0.241mg | 9% |
| Protein | 26.15g | 22.23g | 8% |
| Phosphorus | 204mg | 248mg | 6% |
| Vitamin B1 | 0.093mg | 0.027mg | 6% |
| Vitamin D | 3.7µg | 4.6µg | 5% |
| Vitamin B5 | 0.664mg | 0.404mg | 5% |
| Choline | 51.3mg | 78.7mg | 5% |
| Vitamin D | 150 IU | 183 IU | 4% |
| Iron | 0.69mg | 0.36mg | 4% |
| Copper | 0.075mg | 0.041mg | 4% |
| Potassium | 380mg | 467mg | 3% |
| Fats | 2.65g | 1.62g | 2% |
| Vitamin E | 0.79mg | 0.44mg | 2% |
| Saturated fat | 0.94g | 0.42g | 2% |
| Calories | 128kcal | 109kcal | 1% |
| Cholesterol | 57mg | 61mg | 1% |
| Sodium | 56mg | 89mg | 1% |
| Vitamin A | 0µg | 5µg | 1% |
| Manganese | 0.037mg | 0.013mg | 1% |
| Vitamin K | 0.9µg | 0µg | 1% |
| Folate | 6µg | 10µg | 1% |
| Monounsaturated fat | 0.955g | 0.466g | 1% |
| Polyunsaturated fat | 0.6g | 0.485g | 1% |
| Magnesium | 34mg | 33mg | 0% |
| Calcium | 14mg | 17mg | 0% |
| Zinc | 0.41mg | 0.43mg | 0% |
| Trans fat | 0.025g | N/A | |
| Tryptophan | 0.265mg | 0.296mg | 0% |
| Threonine | 1.156mg | 1.014mg | 0% |
| Isoleucine | 1.22mg | 1.06mg | 0% |
| Leucine | 2.04mg | 1.835mg | 0% |
| Lysine | 2.315mg | 2.188mg | 0% |
| Methionine | 0.766mg | 0.707mg | 0% |
| Phenylalanine | 1.05mg | 0.935mg | 0% |
| Valine | 1.28mg | 1.106mg | 0% |
| Histidine | 0.585mg | 0.502mg | 0% |
| Omega-3 - EPA | 0.005g | 0.107g | N/A |
| Omega-3 - DHA | 0.13g | 0.238g | N/A |
| Omega-3 - ALA | 0.045g | N/A | |
| Omega-3 - DPA | 0.06g | 0.027g | N/A |
| Omega-6 - Eicosadienoic acid | 0.015g | 0.005g | N/A |
People also compare


References
All the values for which the sources are not specified explicitly are taken from FDA’s Food Central. The exact link to the food presented on this page can be found below.
- Tilapia - https://fdc.nal.usda.gov/fdc-app.html#/food-details/175177/nutrients
- Rockfish - https://fdc.nal.usda.gov/fdc-app.html#/food-details/175131/nutrients
All the Daily Values are presented for males aged 31-50, for 2000-calorie diets.