Trout vs. Sea bass — Health Impact and Nutrition Comparison


Summary
Trout is higher in calcium, fats, and vitamin D. Bass provides more cholesterol and is higher in iron. Trout covers 507% of the DV of vitamin D, while the bass does not contain any quantities of that vitamin.
Introduction
This article compares the nutritional profile and health benefits of two of the most famous and affordable fish species - trout and bass. Check the distribution of all the nutrients in the charts below in the corresponding sections.
Actual differences
Trout and bass are two widespread fish species. Trout is a common name for fish native to cold-water parts of the Pacific Ocean in North America and Asia; it is from the salmon family. Asian sea bass is a type of white fish living in salty waters. These species differ in taste, smell, appearance, and texture.
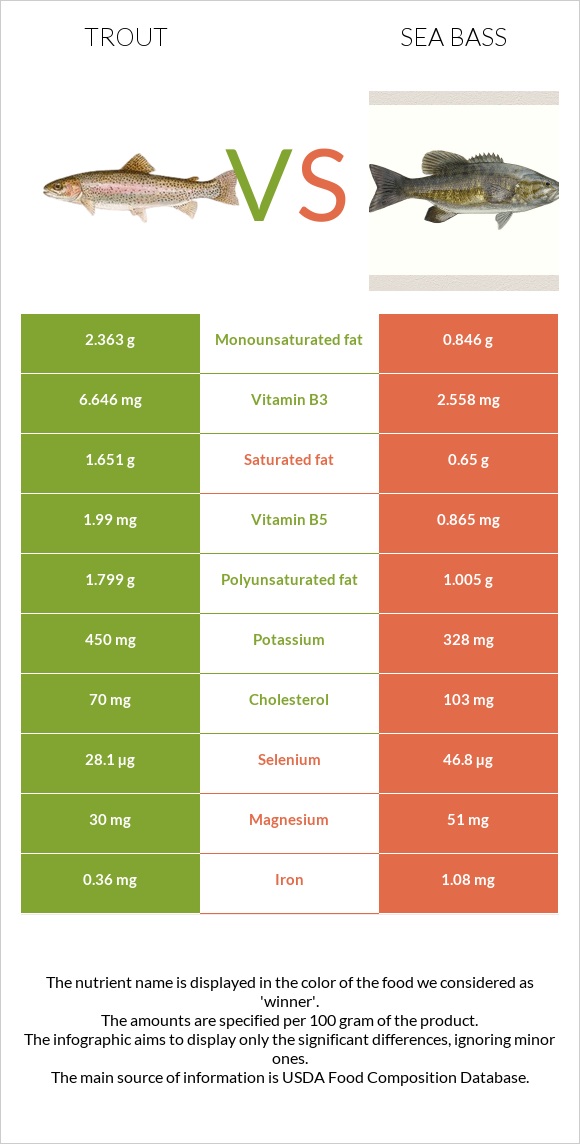
Trout has a bluish-green back covered with black spots, a silver belly, and a pink stripe down the sides of its body, while basses are often grayish-black to dark brown, with the belly being significantly lighter.
The meat of rainbow trout has a delicate, nut-like flavor and is mild, but it also has more bones, while the bass has a sweetness additionally and less bones. Trout smells mild and fishy, but the bass does not smell fishy.
Bass has a meaty and firm texture. Trout has a flaky, tender, and soft texture.
Nutrition
This section will compare cooked trout and bass's macronutrient, mineral, and vitamin contents. Both of them do not provide any amounts of carbs.
Macronutrient Comparison
Contains
more
FatsFats
+146.8%
Contains
more
OtherOther
+820%
Protein
Trout is slightly higher in protein than bass. Per 100g serving, trout provides 23.8g of protein, while bass contains 22.7g of it.
Both provide essential amino acids, such as lysine, histidine, and phenylalanine.
Fat
Trout is more than two times higher in fats than bass. It is richer in both unsaturated and saturated fats. Bass is 33mg higher in cholesterol than trout.
Fat Type Comparison
Contains
more
Mono. FatMonounsaturated fat
+179.3%
Contains
more
Poly. FatPolyunsaturated fat
+79%
Contains
less
Sat. FatSaturated fat
-60.6%
Calories
Trout and bass are classified as medium-calorie foods. Due to its higher fat composition, trout provides more calories than bass. It has 44 more calories per 100g serving.
Minerals
The leader in this section is trout.
Trout provides more calcium and potassium than bass. It is also lower in sodium.
Bass contains more iron and magnesium.
Important to highlight that both fish are high in selenium and phosphorus.
You can check the mineral comparison chart shown below.
Mineral Comparison
Contains
more
CalciumCalcium
+57.9%
Contains
more
PotassiumPotassium
+37.2%
Contains
more
CopperCopper
+37.5%
Contains
less
SodiumSodium
-30.7%
Contains
more
MagnesiumMagnesium
+70%
Contains
more
IronIron
+200%
Contains
more
ManganeseManganese
+46.2%
Contains
more
SeleniumSelenium
+66.5%
Vitamins
In general, trout has a higher vitamin content. It is richer in all the vitamins.
Trout covers 507% of the DV of vitamin D, while the bass does not provide any amounts of it.
Vitamin Comparison
Contains
more
Vitamin CVitamin C
+∞%
Contains
more
Vitamin DVitamin D
+∞%
Contains
more
Vitamin AVitamin A
+222.6%
Contains
more
Vitamin EVitamin E
+∞%
Contains
more
Vitamin B1Vitamin B1
+24.3%
Contains
more
Vitamin B2Vitamin B2
+189.2%
Contains
more
Vitamin B3Vitamin B3
+159.8%
Contains
more
Vitamin B5Vitamin B5
+130.1%
Contains
more
Vitamin B6Vitamin B6
+11.6%
Contains
more
Vitamin KVitamin K
+∞%
Contains
more
FolateFolate
+20%
Health impact
Cardiovascular health
Trout and bass consumption is linked to a reduced risk of cardiovascular disease (1).
The proportion of omega-3 to omega-6 fatty acids is responsible for this. The human body cannot synthesize the long-chain necessary fatty acids like these two substances. We must therefore obtain them through eating. According to a study, heart disease risk increases when blood flow concentrations of omega-6 and omega-3 fatty acids are out of balance (2). Thus, fish consumption can support a healthy diet.
References

Infographic
All nutrients comparison - raw data values
| Nutrient | |
|
DV% diff. |
| Vitamin D* | 759 IU | 95% | |
| Vitamin D | 19µg | 95% | |
| Selenium | 28.1µg | 46.8µg | 34% |
| Vitamin B3 | 6.646mg | 2.558mg | 26% |
| Vitamin B5 | 1.99mg | 0.865mg | 23% |
| Vitamin E | 2.79mg | 19% | |
| Choline | 77.6mg | 14% | |
| Vitamin B12 | 4.11µg | 4.41µg | 13% |
| Cholesterol | 70mg | 103mg | 11% |
| Iron | 0.36mg | 1.08mg | 9% |
| Vitamin A | 100µg | 31µg | 8% |
| Fats | 7.38g | 2.99g | 7% |
| Magnesium | 30mg | 51mg | 5% |
| Vitamin B2 | 0.107mg | 0.037mg | 5% |
| Saturated fat | 1.651g | 0.65g | 5% |
| Polyunsaturated fat | 1.799g | 1.005g | 5% |
| Potassium | 450mg | 328mg | 4% |
| Monounsaturated fat | 2.363g | 0.846g | 4% |
| Vitamin C | 2.9mg | 0mg | 3% |
| Vitamin B6 | 0.386mg | 0.346mg | 3% |
| Calories | 168kcal | 124kcal | 2% |
| Protein | 23.8g | 22.73g | 2% |
| Copper | 0.055mg | 0.04mg | 2% |
| Phosphorus | 270mg | 254mg | 2% |
| Vitamin B1 | 0.143mg | 0.115mg | 2% |
| Calcium | 30mg | 19mg | 1% |
| Sodium | 61mg | 88mg | 1% |
| Folate | 12µg | 10µg | 1% |
| Protein per 100 calories | 14g | 18g | N/A |
| Calories per 10 g protein | 71kcal | 55kcal | N/A |
| Weight per 100 calories | 60g | 81g | N/A |
| Unsaturated / Saturated Fat ratio | 2.5 | 2.8 | N/A |
| Zinc | 0.54mg | 0.51mg | 0% |
| Manganese | 0.013mg | 0.019mg | 0% |
| Vitamin K | 0.1µg | 0% | |
| Trans fat | 0.056g | N/A | |
| Tryptophan | 0.279mg | 0.255mg | 0% |
| Threonine | 1.092mg | 0.997mg | 0% |
| Isoleucine | 1.148mg | 1.047mg | 0% |
| Leucine | 2.025mg | 1.848mg | 0% |
| Lysine | 2.287mg | 2.088mg | 0% |
| Methionine | 0.738mg | 0.673mg | 0% |
| Phenylalanine | 0.973mg | 0.887mg | 0% |
| Valine | 1.283mg | 1.171mg | 0% |
| Histidine | 0.733mg | 0.669mg | 0% |
| Omega-3 - EPA | 0.259g | 0.217g | N/A |
| Omega-3 - DHA | 0.616g | 0.75g | N/A |
| Omega-3 - DPA | 0.109g | N/A | |
| Omega-6 - Eicosadienoic acid | 0.047g | N/A |
People also compare


References
All the values for which the sources are not specified explicitly are taken from FDA’s Food Central. The exact link to the food presented on this page can be found below.
- Trout - https://fdc.nal.usda.gov/fdc-app.html#/food-details/173718/nutrients
- Sea bass - https://fdc.nal.usda.gov/fdc-app.html#/food-details/174228/nutrients
All the Daily Values are presented for males aged 31-50, for 2000-calorie diets.