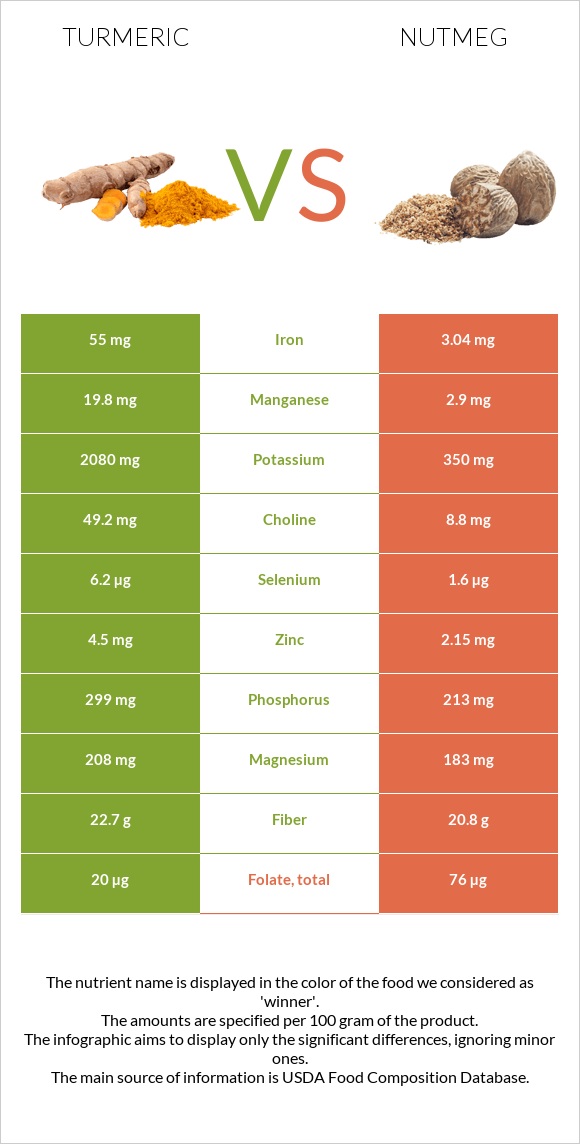
How are turmeric and nutmeg different? Turmeric is richer in manganese, iron, potassium, copper, vitamin E, zinc, and phosphorus, while nutmeg is higher in vitamin B1 and folate. Turmeric covers your daily need for manganese, 735% more than nutmeg. Turmeric is lower in saturated fat. Spices, turmeric, ground and Spices, nutmeg, ground types were used in this article.
Infographic
Mineral Comparison
Mineral comparison score is based on the number of minerals by which one or the other food is richer. The "coverage" charts below show how much of the daily needs can be covered by 300 grams of the food.
8
100 g
300 g
0.25 tsp - 0.5g 1 tbsp - 9.4g
Magnesium
Magnesium
Calcium
Calcium
Potassium
Potassium
Iron
Iron
Copper
Copper
Zinc
Zinc
Phosphorus
Phosphorus
Sodium
Sodium
Manganese
Manganese
Selenium
Selenium
149%
50%
184%
2063%
433%
123%
128%
3.5%
2583%
34%
1
100 g
300 g
0.25 tsp - 0.5g 1 tbsp - 7g
Magnesium
Magnesium
Calcium
Calcium
Potassium
Potassium
Iron
Iron
Copper
Copper
Zinc
Zinc
Phosphorus
Phosphorus
Sodium
Sodium
Manganese
Manganese
Selenium
Selenium
131%
55%
31%
114%
342%
59%
91%
2.1%
378%
8.7%
Vitamin Comparison
Vitamin comparison score is based on the number of vitamins by which one or the other food is richer. The "coverage" charts below show how much of the daily needs can be covered by 300 grams of the food.
4
100 g
300 g
0.25 tsp - 0.5g 1 tbsp - 9.4g
Vitamin C
Vit. C
Vitamin D
Vit. D
Vitamin A
Vit. A
Vitamin E
Vit. E
Vitamin B1
Vit. B1
Vitamin B2
Vit. B2
Vitamin B3
Vit. B3
Vitamin B5
Vit. B5
Vitamin B6
Vit. B6
Vitamin B12
Vit. B12
Vitamin K
Vit. K
Folate
Folate
2.3%
0%
0%
89%
15%
35%
25%
33%
25%
0%
34%
15%
5
100 g
300 g
0.25 tsp - 0.5g 1 tbsp - 7g
Vitamin C
Vit. C
Vitamin D
Vit. D
Vitamin A
Vit. A
Vitamin E
Vit. E
Vitamin B1
Vit. B1
Vitamin B2
Vit. B2
Vitamin B3
Vit. B3
Vitamin B5
Vit. B5
Vitamin B6
Vit. B6
Vitamin B12
Vit. B12
Vitamin K
Vit. K
Folate
Folate
10%
0%
1.7%
0%
87%
13%
24%
0%
37%
0%
0%
57%
All nutrients comparison - raw data values
Nutrient
DV% diff.
Manganese
19.8mg
2.9mg
735%
Iron
55mg
3.04mg
650%
Saturated fat
1.838g
25.94g
110%
Fats
3.25g
36.31g
51%
Potassium
2080mg
350mg
51%
Copper
1.3mg
1.027mg
30%
Vitamin E
4.43mg
0mg
30%
Vitamin B1
0.058mg
0.346mg
24%
Zinc
4.5mg
2.15mg
21%
Folate
20µg
76µg
14%
Phosphorus
299mg
213mg
12%
Calories
312kcal
525kcal
11%
Vitamin B5
0.542mg
11%
Vitamin K
13.4µg
0µg
11%
Protein
9.68g
5.84g
8%
Fiber
22.7g
20.8g
8%
Selenium
6.2µg
1.6µg
8%
Vitamin B2
0.15mg
0.057mg
7%
Choline
49.2mg
8.8mg
7%
Monounsaturated fat
0.449g
3.22g
7%
Carbs
67.14g
49.29g
6%
Magnesium
208mg
183mg
6%
Vitamin B6
0.107mg
0.16mg
4%
Vitamin C
0.7mg
3mg
3%
Polyunsaturated fat
0.756g
0.35g
3%
Calcium
168mg
184mg
2%
Vitamin A
0µg
5µg
1%
Fructose
0.45g
1%
Protein per 100 calories
3.1g
1.1g
N/A
Calories per 10 g protein
322kcal
899kcal
N/A
Weight per 100 calories
32g
19g
N/A
Unsaturated / Saturated Fat ratio
0.66
0.14
N/A
Net carbs
44.44g
28.49g
N/A
Sugar
3.21g
2.99g
N/A
Sodium
27mg
16mg
0%
Vitamin B3
1.35mg
1.299mg
0%
Trans fat
0.056g
N/A
Tryptophan
0.17mg
0%
Threonine
0.33mg
0%
Isoleucine
0.47mg
0%
Leucine
0.81mg
0%
Lysine
0.38mg
0%
Methionine
0.14mg
0%
Phenylalanine
0.53mg
0%
Valine
0.66mg
0%
Histidine
0.15mg
0%
Omega-3 - ALA
0.003g
N/A
Omega-6 - Gamma-linoleic acid
0.081g
N/A
Macronutrient Comparison
Macronutrient breakdown side-by-side comparison
4
10%
3%
67%
13%
7%
Protein:
9.68 g
Fats:
3.25 g
Carbs:
67.14 g
Water:
12.85 g
Other:
7.08 g
1
6%
36%
49%
6%
2%
Protein:
5.84 g
Fats:
36.31 g
Carbs:
49.29 g
Water:
6.23 g
Other:
2.33 g
Contains
more
Protein Protein
+65.8%
Contains
more
Carbs Carbs
+36.2%
Contains
more
Water Water
+106.3%
Contains
more
Other Other
+203.9%
Contains
more
Fats Fats
+1017.2%
Fat Type Comparison
Fat type breakdown side-by-side comparison
2
60%
15%
25%
Saturated fat:
Sat. Fat
1.838 g
Monounsaturated fat:
Mono. Fat
0.449 g
Polyunsaturated fat:
Poly. Fat
0.756 g
1
88%
11%
Saturated fat:
Sat. Fat
25.94 g
Monounsaturated fat:
Mono. Fat
3.22 g
Polyunsaturated fat:
Poly. Fat
0.35 g
Contains
less
Sat. Fat Saturated fat
-92.9%
Contains
more
Poly. Fat Polyunsaturated fat
+116%
Contains
more
Mono. Fat Monounsaturated fat
+617.1%