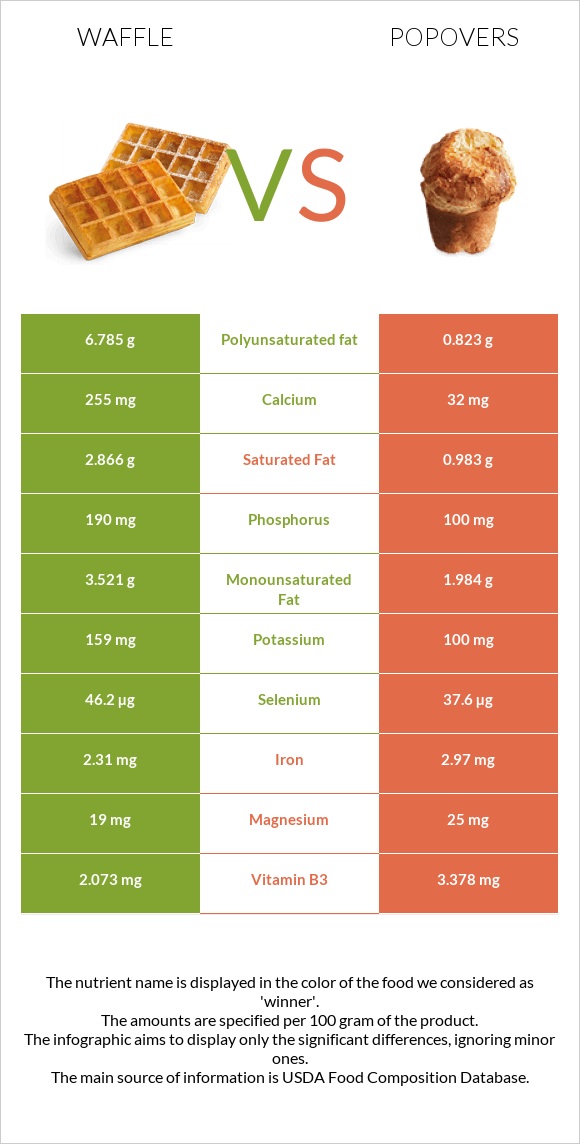
What are the main differences between waffle and popovers? Waffle is richer in calcium, selenium, vitamin B2, and phosphorus, while popovers are higher in folate, manganese, vitamin B1, and copper. Popovers' daily need coverage for folate is 25% higher. We used Waffles, plain, prepared from recipe and Popovers, dry mix, enriched types in this comparison.
Infographic
Mineral Comparison
Mineral comparison score is based on the number of minerals by which one or the other food is richer. The "coverage" charts below show how much of the daily needs can be covered by 300 grams of the food.
5
100 g
300 g
1 oz - 28.35g 1 waffle, round (7" dia) - 75g
Magnesium
Magnesium
Calcium
Calcium
Potassium
Potassium
Iron
Iron
Copper
Copper
Zinc
Zinc
Phosphorus
Phosphorus
Sodium
Sodium
Manganese
Manganese
Selenium
Selenium
14%
77%
14%
87%
21%
19%
81%
67%
35%
252%
5
100 g
300 g
1 oz - 28.35g 1 package (6 oz) - 170g
Magnesium
Magnesium
Calcium
Calcium
Potassium
Potassium
Iron
Iron
Copper
Copper
Zinc
Zinc
Phosphorus
Phosphorus
Sodium
Sodium
Manganese
Manganese
Selenium
Selenium
18%
9.6%
8.8%
111%
57%
24%
43%
118%
97%
205%
Vitamin Comparison
Vitamin comparison score is based on the number of vitamins by which one or the other food is richer. The "coverage" charts below show how much of the daily needs can be covered by 300 grams of the food.
5
100 g
300 g
1 oz - 28.35g 1 waffle, round (7" dia) - 75g
Vitamin C
Vit. C
Vitamin D
Vit. D
Vitamin A
Vit. A
Vitamin E
Vit. E
Vitamin B1
Vit. B1
Vitamin B2
Vit. B2
Vitamin B3
Vit. B3
Vitamin B5
Vit. B5
Vitamin B6
Vit. B6
Vitamin B12
Vit. B12
Vitamin K
Vit. K
Folate
Folate
1.3%
0%
22%
0%
66%
80%
39%
29%
13%
31%
0%
35%
3
100 g
300 g
1 oz - 28.35g 1 package (6 oz) - 170g
Vitamin C
Vit. C
Vitamin D
Vit. D
Vitamin A
Vit. A
Vitamin E
Vit. E
Vitamin B1
Vit. B1
Vitamin B2
Vit. B2
Vitamin B3
Vit. B3
Vitamin B5
Vit. B5
Vitamin B6
Vit. B6
Vitamin B12
Vit. B12
Vitamin K
Vit. K
Folate
Folate
0.33%
0%
0%
0%
108%
34%
63%
29%
9.7%
10%
0%
109%
All nutrients comparison - raw data values
Nutrient
DV% diff.
Polyunsaturated fat
6.785g
0.823g
40%
Folate
46µg
145µg
25%
Cholesterol
69mg
0mg
23%
Calcium
255mg
32mg
22%
Manganese
0.265mg
0.741mg
21%
Sodium
511mg
906mg
17%
Selenium
46.2µg
37.6µg
16%
Fats
14.1g
4.3g
15%
Vitamin B2
0.347mg
0.147mg
15%
Vitamin B1
0.263mg
0.43mg
14%
Carbs
32.9g
71g
13%
Phosphorus
190mg
100mg
13%
Copper
0.062mg
0.171mg
12%
Saturated fat
2.866g
0.983g
9%
Iron
2.31mg
2.97mg
8%
Vitamin B3
2.073mg
3.378mg
8%
Vitamin A
65µg
0µg
7%
Vitamin B12
0.25µg
0.08µg
7%
Protein
7.9g
10.4g
5%
Calories
291kcal
371kcal
4%
Monounsaturated fat
3.521g
1.984g
4%
Potassium
159mg
100mg
2%
Zinc
0.68mg
0.88mg
2%
Magnesium
19mg
25mg
1%
Vitamin B6
0.056mg
0.042mg
1%
Protein per 100 calories
2.7g
2.8g
N/A
Calories per 10 g protein
368kcal
357kcal
N/A
Weight per 100 calories
34g
27g
N/A
Unsaturated / Saturated Fat ratio
3.6
2.9
N/A
Vitamin C
0.4mg
0.1mg
0%
Net carbs
32.9g
71g
N/A
Vitamin B5
0.485mg
0.48mg
0%
Tryptophan
0.099mg
0.123mg
0%
Threonine
0.289mg
0.293mg
0%
Isoleucine
0.362mg
0.407mg
0%
Leucine
0.63mg
0.747mg
0%
Lysine
0.384mg
0.249mg
0%
Methionine
0.179mg
0.191mg
0%
Phenylalanine
0.395mg
0.517mg
0%
Valine
0.409mg
0.458mg
0%
Histidine
0.187mg
0.229mg
0%
Omega-3 - EPA
0.001g
N/A
Omega-3 - DHA
0.006g
N/A
Macronutrient Comparison
Macronutrient breakdown side-by-side comparison
3
8%
14%
33%
42%
3%
Protein:
7.9 g
Fats:
14.1 g
Carbs:
32.9 g
Water:
42 g
Other:
3.1 g
2
10%
4%
71%
12%
3%
Protein:
10.4 g
Fats:
4.3 g
Carbs:
71 g
Water:
11.7 g
Other:
2.6 g
Contains
more
Fats Fats
+227.9%
Contains
more
Water Water
+259%
Contains
more
Other Other
+19.2%
Contains
more
Protein Protein
+31.6%
Contains
more
Carbs Carbs
+115.8%
Fat Type Comparison
Fat type breakdown side-by-side comparison
2
22%
27%
52%
Saturated fat:
Sat. Fat
2.866 g
Monounsaturated fat:
Mono. Fat
3.521 g
Polyunsaturated fat:
Poly. Fat
6.785 g
1
26%
52%
22%
Saturated fat:
Sat. Fat
0.983 g
Monounsaturated fat:
Mono. Fat
1.984 g
Polyunsaturated fat:
Poly. Fat
0.823 g
Contains
more
Mono. Fat Monounsaturated fat
+77.5%
Contains
more
Poly. Fat Polyunsaturated fat
+724.4%
Contains
less
Sat. Fat Saturated fat
-65.7%