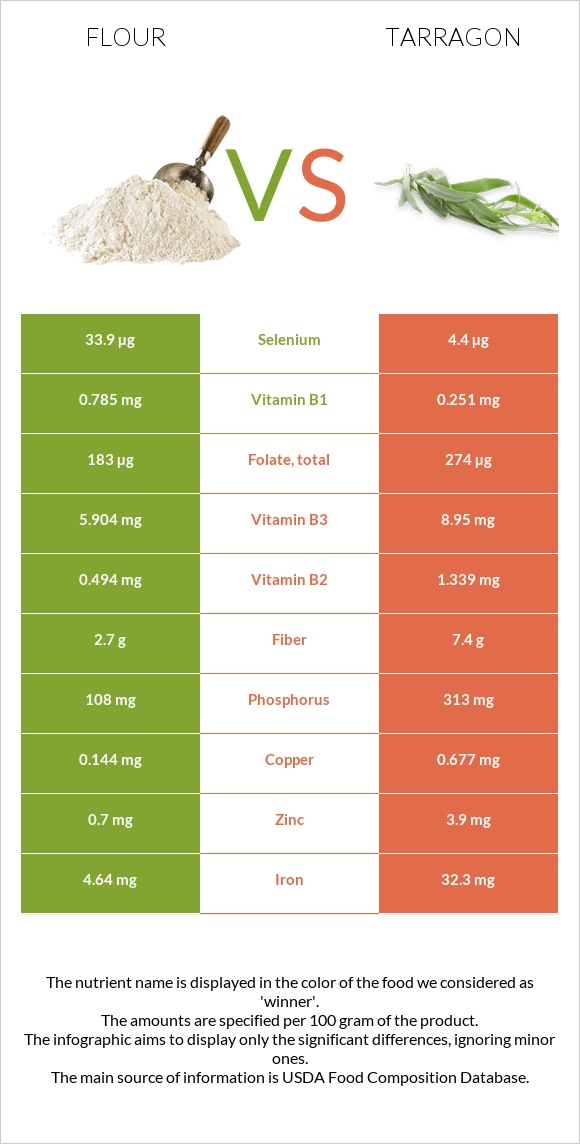
Important differences between flour and tarragon Tarragon has more iron, manganese, vitamin B6, calcium, potassium, vitamin A, magnesium, vitamin B2, copper, and vitamin C than flour. Tarragon's daily need coverage for iron is 346% more. Flour has a higher glycemic index. The glycemic index of flour is 72, while the glycemic index of tarragon is 0. The food varieties used in the comparison are Wheat flour, white, all-purpose, enriched, bleached and Spices, tarragon, dried .
Infographic
Mineral Comparison
Mineral comparison score is based on the number of minerals by which one or the other food is richer. The "coverage" charts below show how much of the daily needs can be covered by 300 grams of the food.
2
100 g
300 g
1 cup - 125g
Magnesium
Magnesium
Calcium
Calcium
Potassium
Potassium
Iron
Iron
Copper
Copper
Zinc
Zinc
Phosphorus
Phosphorus
Sodium
Sodium
Manganese
Manganese
Selenium
Selenium
16%
4.5%
9.4%
174%
48%
19%
46%
0.26%
89%
185%
8
100 g
300 g
0.25 tsp - 0.5g 1 tsp, ground - 1.6g 1 tbsp, leaves - 1.8g 1 tbsp, ground - 4.8g
Magnesium
Magnesium
Calcium
Calcium
Potassium
Potassium
Iron
Iron
Copper
Copper
Zinc
Zinc
Phosphorus
Phosphorus
Sodium
Sodium
Manganese
Manganese
Selenium
Selenium
248%
342%
266%
1211%
226%
106%
134%
8.1%
1039%
24%
Vitamin Comparison
Vitamin comparison score is based on the number of vitamins by which one or the other food is richer. The "coverage" charts below show how much of the daily needs can be covered by 300 grams of the food.
4
100 g
300 g
1 cup - 125g
Vitamin C
Vit. C
Vitamin D
Vit. D
Vitamin A
Vit. A
Vitamin E
Vit. E
Vitamin B1
Vit. B1
Vitamin B2
Vit. B2
Vitamin B3
Vit. B3
Vitamin B5
Vit. B5
Vitamin B6
Vit. B6
Vitamin B12
Vit. B12
Vitamin K
Vit. K
Folate
Folate
0%
0%
0%
1.2%
196%
114%
111%
26%
10%
0%
0.75%
137%
6
100 g
300 g
0.25 tsp - 0.5g 1 tsp, ground - 1.6g 1 tbsp, leaves - 1.8g 1 tbsp, ground - 4.8g
Vitamin C
Vit. C
Vitamin D
Vit. D
Vitamin A
Vit. A
Vitamin E
Vit. E
Vitamin B1
Vit. B1
Vitamin B2
Vit. B2
Vitamin B3
Vit. B3
Vitamin B5
Vit. B5
Vitamin B6
Vit. B6
Vitamin B12
Vit. B12
Vitamin K
Vit. K
Folate
Folate
167%
0%
70%
0%
63%
309%
168%
0%
556%
0%
0%
206%
All nutrients comparison - raw data values
Nutrient
DV% diff.
Iron
4.64mg
32.3mg
346%
Manganese
0.682mg
7.967mg
317%
Vitamin B6
0.044mg
2.41mg
182%
Calcium
15mg
1139mg
112%
Potassium
107mg
3020mg
86%
Magnesium
22mg
347mg
77%
Vitamin B2
0.494mg
1.339mg
65%
Copper
0.144mg
0.677mg
59%
Vitamin C
0mg
50mg
56%
Selenium
33.9µg
4.4µg
54%
Vitamin B1
0.785mg
0.251mg
45%
Zinc
0.7mg
3.9mg
29%
Phosphorus
108mg
313mg
29%
Protein
10.33g
22.77g
25%
Vitamin A
0µg
210µg
23%
Folate
183µg
274µg
23%
Polyunsaturated fat
0.413g
3.698g
22%
Fiber
2.7g
7.4g
19%
Vitamin B3
5.904mg
8.95mg
19%
Fats
0.98g
7.24g
10%
Carbs
76.31g
50.22g
9%
Vitamin B5
0.438mg
9%
Saturated fat
0.155g
1.881g
8%
Calories
364kcal
295kcal
3%
Sodium
2mg
62mg
3%
Choline
10.4mg
2%
Monounsaturated fat
0.087g
0.474g
1%
Protein per 100 calories
2.8g
7.7g
N/A
Calories per 10 g protein
352kcal
130kcal
N/A
Weight per 100 calories
27g
34g
N/A
Unsaturated / Saturated Fat ratio
3.2
2.2
N/A
Net carbs
73.61g
42.82g
N/A
Sugar
0.27g
N/A
Vitamin E
0.06mg
0%
Vitamin K
0.3µg
0%
Tryptophan
0.127mg
0%
Threonine
0.281mg
0%
Isoleucine
0.357mg
0%
Leucine
0.71mg
0%
Lysine
0.228mg
0%
Methionine
0.183mg
0%
Phenylalanine
0.52mg
0%
Valine
0.415mg
0%
Histidine
0.23mg
0%
Macronutrient Comparison
Macronutrient breakdown side-by-side comparison
2
10%
76%
12%
Protein:
10.33 g
Fats:
0.98 g
Carbs:
76.31 g
Water:
11.92 g
Other:
0.46 g
3
23%
7%
50%
8%
12%
Protein:
22.77 g
Fats:
7.24 g
Carbs:
50.22 g
Water:
7.74 g
Other:
12.03 g
Contains
more
Carbs Carbs
+52%
Contains
more
Water Water
+54%
Contains
more
Protein Protein
+120.4%
Contains
more
Fats Fats
+638.8%
Contains
more
Other Other
+2515.2%
Fat Type Comparison
Fat type breakdown side-by-side comparison
1
24%
13%
63%
Saturated fat:
Sat. Fat
0.155 g
Monounsaturated fat:
Mono. Fat
0.087 g
Polyunsaturated fat:
Poly. Fat
0.413 g
2
31%
8%
61%
Saturated fat:
Sat. Fat
1.881 g
Monounsaturated fat:
Mono. Fat
0.474 g
Polyunsaturated fat:
Poly. Fat
3.698 g
Contains
less
Sat. Fat Saturated fat
-91.8%
Contains
more
Mono. Fat Monounsaturated fat
+444.8%
Contains
more
Poly. Fat Polyunsaturated fat
+795.4%