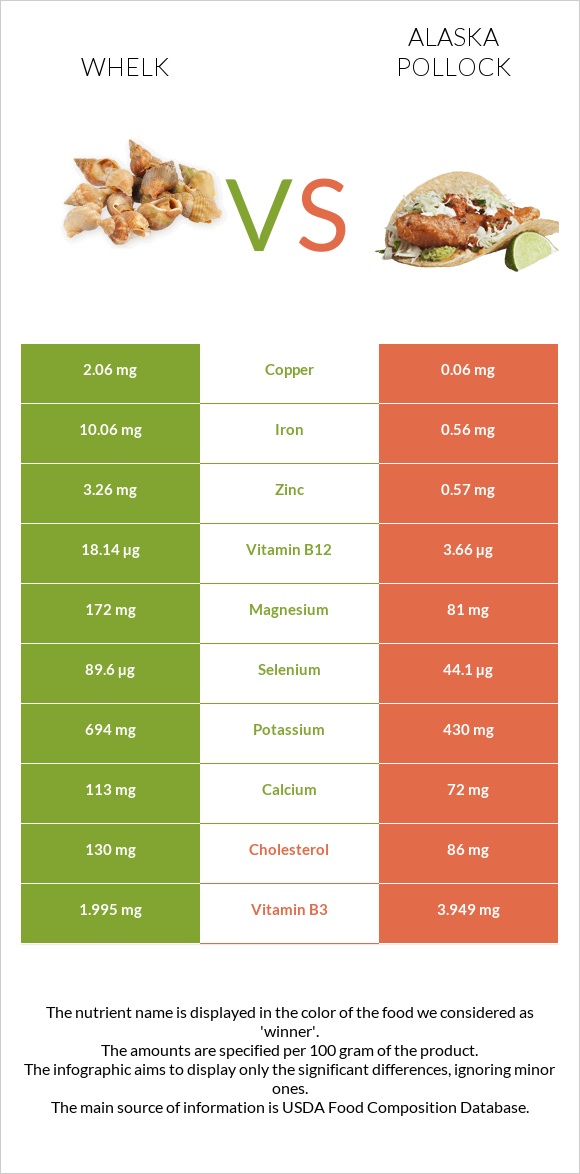
A recap on the differences between whelk and pollock Whelk is higher in vitamin B12, copper, iron, selenium, manganese, vitamin B6, zinc, and magnesium, yet pollock is higher in vitamin B3. Whelk covers your daily vitamin B12 needs 603% more than pollock. Whelk contains 49 times more manganese than pollock. While whelk contains 0.89mg of manganese, pollock contains only 0.018mg. The amount of cholesterol in pollock is lower. Food varieties used in this article are Mollusks, whelk, unspecified, cooked, moist heat and Fish, pollock, Alaska, cooked, dry heat (may have been previously frozen) .
Infographic
Mineral Comparison
Mineral comparison score is based on the number of minerals by which one or the other food is richer. The "coverage" charts below show how much of the daily needs can be covered by 300 grams of the food.
8
100 g
300 g
3 oz - 85g
Magnesium
Magnesium
Calcium
Calcium
Potassium
Potassium
Iron
Iron
Copper
Copper
Zinc
Zinc
Phosphorus
Phosphorus
Sodium
Sodium
Manganese
Manganese
Selenium
Selenium
123%
34%
61%
377%
687%
89%
121%
54%
116%
489%
0
100 g
300 g
1 fillet - 60g 3 oz - 85g
Magnesium
Magnesium
Calcium
Calcium
Potassium
Potassium
Iron
Iron
Copper
Copper
Zinc
Zinc
Phosphorus
Phosphorus
Sodium
Sodium
Manganese
Manganese
Selenium
Selenium
58%
22%
38%
21%
20%
16%
114%
55%
2.3%
241%
Vitamin Comparison
Vitamin comparison score is based on the number of vitamins by which one or the other food is richer. The "coverage" charts below show how much of the daily needs can be covered by 300 grams of the food.
5
100 g
300 g
3 oz - 85g
Vitamin C
Vit. C
Vitamin D
Vit. D
Vitamin A
Vit. A
Vitamin E
Vit. E
Vitamin B1
Vit. B1
Vitamin B2
Vit. B2
Vitamin B3
Vit. B3
Vitamin B5
Vit. B5
Vitamin B6
Vit. B6
Vitamin B12
Vit. B12
Vitamin K
Vit. K
Folate
Folate
23%
0%
16%
0%
12%
49%
37%
24%
150%
2268%
0%
8.3%
5
100 g
300 g
1 fillet - 60g 3 oz - 85g
Vitamin C
Vit. C
Vitamin D
Vit. D
Vitamin A
Vit. A
Vitamin E
Vit. E
Vitamin B1
Vit. B1
Vitamin B2
Vit. B2
Vitamin B3
Vit. B3
Vitamin B5
Vit. B5
Vitamin B6
Vit. B6
Vitamin B12
Vit. B12
Vitamin K
Vit. K
Folate
Folate
0%
20%
5.7%
5.6%
14%
51%
74%
26%
76%
458%
0.25%
2.3%
All nutrients comparison - raw data values
Nutrient
DV% diff.
Vitamin B12
18.14µg
3.66µg
603%
Copper
2.06mg
0.06mg
222%
Iron
10.06mg
0.56mg
119%
Selenium
89.6µg
44.1µg
83%
Protein
47.68g
23.48g
48%
Manganese
0.89mg
0.018mg
38%
Vitamin B6
0.65mg
0.329mg
25%
Zinc
3.26mg
0.57mg
24%
Magnesium
172mg
81mg
22%
Choline
91.6mg
17%
Cholesterol
130mg
86mg
15%
Vitamin B3
1.995mg
3.949mg
12%
Calories
275kcal
111kcal
8%
Vitamin C
6.8mg
0mg
8%
Potassium
694mg
430mg
8%
Vitamin D
1.3µg
7%
Vitamin D*
51 IU
6%
Carbs
15.52g
0g
5%
Calcium
113mg
72mg
4%
Vitamin A
49µg
17µg
4%
Polyunsaturated fat
0.046g
0.583g
4%
Phosphorus
282mg
267mg
2%
Vitamin E
0.28mg
2%
Folate
11µg
3µg
2%
Fats
0.8g
1.18g
1%
Vitamin B2
0.214mg
0.223mg
1%
Vitamin B5
0.4mg
0.432mg
1%
Protein per 100 calories
17g
21g
N/A
Calories per 10 g protein
58kcal
47kcal
N/A
Weight per 100 calories
36g
90g
N/A
Net carbs
15.52g
0g
N/A
Sodium
412mg
419mg
0%
Vitamin B1
0.049mg
0.054mg
0%
Vitamin K
0.1µg
0%
Saturated fat
0.062g
0.159g
0%
Monounsaturated fat
0.056g
0.134g
0%
Tryptophan
0.618mg
0.263mg
0%
Threonine
2.136mg
1.029mg
0%
Isoleucine
1.655mg
1.082mg
0%
Leucine
3.807mg
1.908mg
0%
Lysine
2.93mg
2.157mg
0%
Methionine
1.205mg
0.696mg
0%
Phenylalanine
1.648mg
0.917mg
0%
Valine
2.075mg
1.21mg
0%
Histidine
0.977mg
0.691mg
0%
Omega-3 - EPA
0.008g
0.086g
N/A
Omega-3 - DHA
0.012g
0.423g
N/A
Omega-3 - DPA
0.027g
N/A
Macronutrient Comparison
Macronutrient breakdown side-by-side comparison
3
48%
16%
32%
4%
Protein:
47.68 g
Fats:
0.8 g
Carbs:
15.52 g
Water:
32 g
Other:
4 g
2
23%
74%
2%
Protein:
23.48 g
Fats:
1.18 g
Carbs:
0 g
Water:
73.65 g
Other:
1.69 g
Contains
more
Protein Protein
+103.1%
Contains
more
Carbs Carbs
+∞%
Contains
more
Other Other
+136.7%
Contains
more
Fats Fats
+47.5%
Contains
more
Water Water
+130.2%
Fat Type Comparison
Fat type breakdown side-by-side comparison
1
38%
34%
28%
Saturated fat:
Sat. Fat
0.062 g
Monounsaturated fat:
Mono. Fat
0.056 g
Polyunsaturated fat:
Poly. Fat
0.046 g
2
18%
15%
67%
Saturated fat:
Sat. Fat
0.159 g
Monounsaturated fat:
Mono. Fat
0.134 g
Polyunsaturated fat:
Poly. Fat
0.583 g
Contains
less
Sat. Fat Saturated fat
-61%
Contains
more
Mono. Fat Monounsaturated fat
+139.3%
Contains
more
Poly. Fat Polyunsaturated fat
+1167.4%