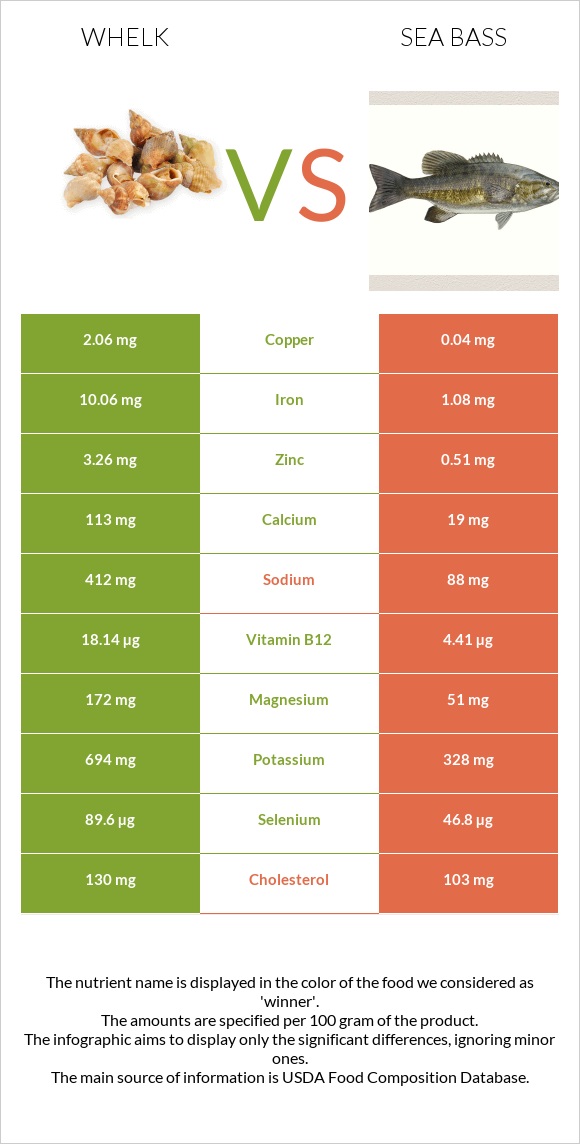
What are the main differences between whelk and sea bass? Whelk has more vitamin B12, copper, iron, selenium, manganese, magnesium, zinc, vitamin B6, and vitamin B2 than sea bass. Whelk's daily need coverage for vitamin B12 is 572% higher. Sea bass has 52 times less copper than whelk. Whelk has 2.06mg of copper, while sea bass has 0.04mg. Sea bass is lower in sodium. We used Mollusks, whelk, unspecified, cooked, moist heat and Fish, bass, striped, cooked, dry heat types in this comparison.
Infographic
Mineral Comparison
Mineral comparison score is based on the number of minerals by which one or the other food is richer. The "coverage" charts below show how much of the daily needs can be covered by 300 grams of the food.
8
100 g
300 g
3 oz - 85g
Magnesium
Magnesium
Calcium
Calcium
Potassium
Potassium
Iron
Iron
Copper
Copper
Zinc
Zinc
Phosphorus
Phosphorus
Sodium
Sodium
Manganese
Manganese
Selenium
Selenium
123%
34%
61%
377%
687%
89%
121%
54%
116%
489%
1
100 g
300 g
3 oz - 85g 1 fillet - 124g
Magnesium
Magnesium
Calcium
Calcium
Potassium
Potassium
Iron
Iron
Copper
Copper
Zinc
Zinc
Phosphorus
Phosphorus
Sodium
Sodium
Manganese
Manganese
Selenium
Selenium
36%
5.7%
29%
41%
13%
14%
109%
11%
2.5%
255%
Vitamin Comparison
Vitamin comparison score is based on the number of vitamins by which one or the other food is richer. The "coverage" charts below show how much of the daily needs can be covered by 300 grams of the food.
5
100 g
300 g
3 oz - 85g
Vitamin C
Vit. C
Vitamin D
Vit. D
Vitamin A
Vit. A
Vitamin E
Vit. E
Vitamin B1
Vit. B1
Vitamin B2
Vit. B2
Vitamin B3
Vit. B3
Vitamin B5
Vit. B5
Vitamin B6
Vit. B6
Vitamin B12
Vit. B12
Vitamin K
Vit. K
Folate
Folate
23%
0%
16%
0%
12%
49%
37%
24%
150%
2268%
0%
8.3%
3
100 g
300 g
3 oz - 85g 1 fillet - 124g
Vitamin C
Vit. C
Vitamin D
Vit. D
Vitamin A
Vit. A
Vitamin E
Vit. E
Vitamin B1
Vit. B1
Vitamin B2
Vit. B2
Vitamin B3
Vit. B3
Vitamin B5
Vit. B5
Vitamin B6
Vit. B6
Vitamin B12
Vit. B12
Vitamin K
Vit. K
Folate
Folate
0%
0%
10%
0%
29%
8.5%
48%
52%
80%
551%
0%
7.5%
All nutrients comparison - raw data values
Nutrient
DV% diff.
Vitamin B12
18.14µg
4.41µg
572%
Copper
2.06mg
0.04mg
224%
Iron
10.06mg
1.08mg
112%
Selenium
89.6µg
46.8µg
78%
Protein
47.68g
22.73g
50%
Manganese
0.89mg
0.019mg
38%
Magnesium
172mg
51mg
29%
Zinc
3.26mg
0.51mg
25%
Vitamin B6
0.65mg
0.346mg
23%
Sodium
412mg
88mg
14%
Vitamin B2
0.214mg
0.037mg
14%
Potassium
694mg
328mg
11%
Cholesterol
130mg
103mg
9%
Calcium
113mg
19mg
9%
Vitamin B5
0.4mg
0.865mg
9%
Calories
275kcal
124kcal
8%
Vitamin C
6.8mg
0mg
8%
Vitamin B1
0.049mg
0.115mg
6%
Polyunsaturated fat
0.046g
1.005g
6%
Carbs
15.52g
0g
5%
Phosphorus
282mg
254mg
4%
Vitamin B3
1.995mg
2.558mg
4%
Fats
0.8g
2.99g
3%
Saturated fat
0.062g
0.65g
3%
Vitamin A
49µg
31µg
2%
Monounsaturated fat
0.056g
0.846g
2%
Protein per 100 calories
17g
18g
N/A
Calories per 10 g protein
58kcal
55kcal
N/A
Weight per 100 calories
36g
81g
N/A
Unsaturated / Saturated Fat ratio
1.6
2.8
N/A
Net carbs
15.52g
0g
N/A
Folate
11µg
10µg
0%
Tryptophan
0.618mg
0.255mg
0%
Threonine
2.136mg
0.997mg
0%
Isoleucine
1.655mg
1.047mg
0%
Leucine
3.807mg
1.848mg
0%
Lysine
2.93mg
2.088mg
0%
Methionine
1.205mg
0.673mg
0%
Phenylalanine
1.648mg
0.887mg
0%
Valine
2.075mg
1.171mg
0%
Histidine
0.977mg
0.669mg
0%
Omega-3 - EPA
0.008g
0.217g
N/A
Omega-3 - DHA
0.012g
0.75g
N/A
Macronutrient Comparison
Macronutrient breakdown side-by-side comparison
3
48%
16%
32%
4%
Protein:
47.68 g
Fats:
0.8 g
Carbs:
15.52 g
Water:
32 g
Other:
4 g
2
23%
3%
73%
Protein:
22.73 g
Fats:
2.99 g
Carbs:
0 g
Water:
73.36 g
Other:
0.92 g
Contains
more
Protein Protein
+109.8%
Contains
more
Carbs Carbs
+∞%
Contains
more
Other Other
+334.8%
Contains
more
Fats Fats
+273.8%
Contains
more
Water Water
+129.3%
Fat Type Comparison
Fat type breakdown side-by-side comparison
1
38%
34%
28%
Saturated fat:
Sat. Fat
0.062 g
Monounsaturated fat:
Mono. Fat
0.056 g
Polyunsaturated fat:
Poly. Fat
0.046 g
2
26%
34%
40%
Saturated fat:
Sat. Fat
0.65 g
Monounsaturated fat:
Mono. Fat
0.846 g
Polyunsaturated fat:
Poly. Fat
1.005 g
Contains
less
Sat. Fat Saturated fat
-90.5%
Contains
more
Mono. Fat Monounsaturated fat
+1410.7%
Contains
more
Poly. Fat Polyunsaturated fat
+2084.8%