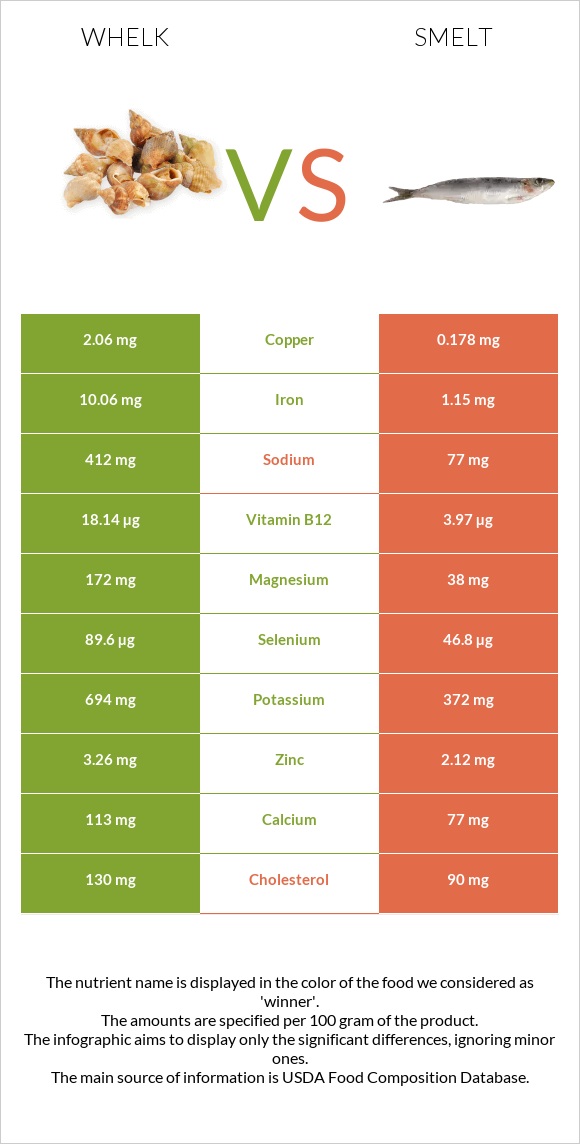
How are whelk and smelt different? Whelk is higher than smelt in vitamin B12, copper, iron, selenium, vitamin B6, magnesium, zinc, and potassium. Whelk covers your daily need for vitamin B12, 590% more than smelt. Whelk contains 12 times more copper than smelt. Whelk contains 2.06mg of copper, while smelt contains 0.178mg. Smelt is lower in sodium. Mollusks, whelk, unspecified, cooked, moist heat and Fish, smelt, rainbow, cooked, dry heat types were used in this article.
Infographic
Mineral Comparison
Mineral comparison score is based on the number of minerals by which one or the other food is richer. The "coverage" charts below show how much of the daily needs can be covered by 300 grams of the food.
7
100 g
300 g
3 oz - 85g
Magnesium
Magnesium
Calcium
Calcium
Potassium
Potassium
Iron
Iron
Copper
Copper
Zinc
Zinc
Phosphorus
Phosphorus
Sodium
Sodium
Manganese
Manganese
Selenium
Selenium
123%
34%
61%
377%
687%
89%
121%
54%
116%
489%
1
100 g
300 g
3 oz - 85g
Magnesium
Magnesium
Calcium
Calcium
Potassium
Potassium
Iron
Iron
Copper
Copper
Zinc
Zinc
Phosphorus
Phosphorus
Sodium
Sodium
Manganese
Manganese
Selenium
Selenium
27%
23%
33%
43%
59%
58%
126%
10%
117%
255%
Vitamin Comparison
Vitamin comparison score is based on the number of vitamins by which one or the other food is richer. The "coverage" charts below show how much of the daily needs can be covered by 300 grams of the food.
8
100 g
300 g
3 oz - 85g
Vitamin C
Vit. C
Vitamin D
Vit. D
Vitamin A
Vit. A
Vitamin E
Vit. E
Vitamin B1
Vit. B1
Vitamin B2
Vit. B2
Vitamin B3
Vit. B3
Vitamin B5
Vit. B5
Vitamin B6
Vit. B6
Vitamin B12
Vit. B12
Vitamin K
Vit. K
Folate
Folate
23%
0%
16%
0%
12%
49%
37%
24%
150%
2268%
0%
8.3%
1
100 g
300 g
3 oz - 85g
Vitamin C
Vit. C
Vitamin D
Vit. D
Vitamin A
Vit. A
Vitamin E
Vit. E
Vitamin B1
Vit. B1
Vitamin B2
Vit. B2
Vitamin B3
Vit. B3
Vitamin B5
Vit. B5
Vitamin B6
Vit. B6
Vitamin B12
Vit. B12
Vitamin K
Vit. K
Folate
Folate
0%
0%
5.7%
0%
2.5%
34%
33%
44%
39%
496%
0%
3.8%
All nutrients comparison - raw data values
Nutrient
DV% diff.
Vitamin B12
18.14µg
3.97µg
590%
Copper
2.06mg
0.178mg
209%
Iron
10.06mg
1.15mg
111%
Selenium
89.6µg
46.8µg
78%
Protein
47.68g
22.6g
50%
Vitamin B6
0.65mg
0.17mg
37%
Magnesium
172mg
38mg
32%
Sodium
412mg
77mg
15%
Cholesterol
130mg
90mg
13%
Zinc
3.26mg
2.12mg
10%
Potassium
694mg
372mg
9%
Calories
275kcal
124kcal
8%
Vitamin C
6.8mg
0mg
8%
Vitamin B5
0.4mg
0.74mg
7%
Polyunsaturated fat
0.046g
1.135g
7%
Carbs
15.52g
0g
5%
Vitamin B2
0.214mg
0.146mg
5%
Fats
0.8g
3.1g
4%
Calcium
113mg
77mg
4%
Vitamin A
49µg
17µg
4%
Vitamin B1
0.049mg
0.01mg
3%
Phosphorus
282mg
295mg
2%
Folate
11µg
5µg
2%
Saturated fat
0.062g
0.579g
2%
Monounsaturated fat
0.056g
0.822g
2%
Vitamin B3
1.995mg
1.766mg
1%
Protein per 100 calories
17g
18g
N/A
Calories per 10 g protein
58kcal
55kcal
N/A
Weight per 100 calories
36g
81g
N/A
Unsaturated / Saturated Fat ratio
1.6
3.4
N/A
Net carbs
15.52g
0g
N/A
Manganese
0.89mg
0.9mg
0%
Tryptophan
0.618mg
0.253mg
0%
Threonine
2.136mg
0.991mg
0%
Isoleucine
1.655mg
1.041mg
0%
Leucine
3.807mg
1.837mg
0%
Lysine
2.93mg
2.076mg
0%
Methionine
1.205mg
0.669mg
0%
Phenylalanine
1.648mg
0.882mg
0%
Valine
2.075mg
1.164mg
0%
Histidine
0.977mg
0.665mg
0%
Omega-3 - EPA
0.008g
0.353g
N/A
Omega-3 - DHA
0.012g
0.536g
N/A
Omega-3 - DPA
0.023g
N/A
Macronutrient Comparison
Macronutrient breakdown side-by-side comparison
3
48%
16%
32%
4%
Protein:
47.68 g
Fats:
0.8 g
Carbs:
15.52 g
Water:
32 g
Other:
4 g
2
23%
3%
73%
Protein:
22.6 g
Fats:
3.1 g
Carbs:
0 g
Water:
72.79 g
Other:
1.51 g
Contains
more
Protein Protein
+111%
Contains
more
Carbs Carbs
+∞%
Contains
more
Other Other
+164.9%
Contains
more
Fats Fats
+287.5%
Contains
more
Water Water
+127.5%
Fat Type Comparison
Fat type breakdown side-by-side comparison
1
38%
34%
28%
Saturated fat:
Sat. Fat
0.062 g
Monounsaturated fat:
Mono. Fat
0.056 g
Polyunsaturated fat:
Poly. Fat
0.046 g
2
23%
32%
45%
Saturated fat:
Sat. Fat
0.579 g
Monounsaturated fat:
Mono. Fat
0.822 g
Polyunsaturated fat:
Poly. Fat
1.135 g
Contains
less
Sat. Fat Saturated fat
-89.3%
Contains
more
Mono. Fat Monounsaturated fat
+1367.9%
Contains
more
Poly. Fat Polyunsaturated fat
+2367.4%