Whiting vs. Perch — Health Impact and Nutrition Comparison


Summary
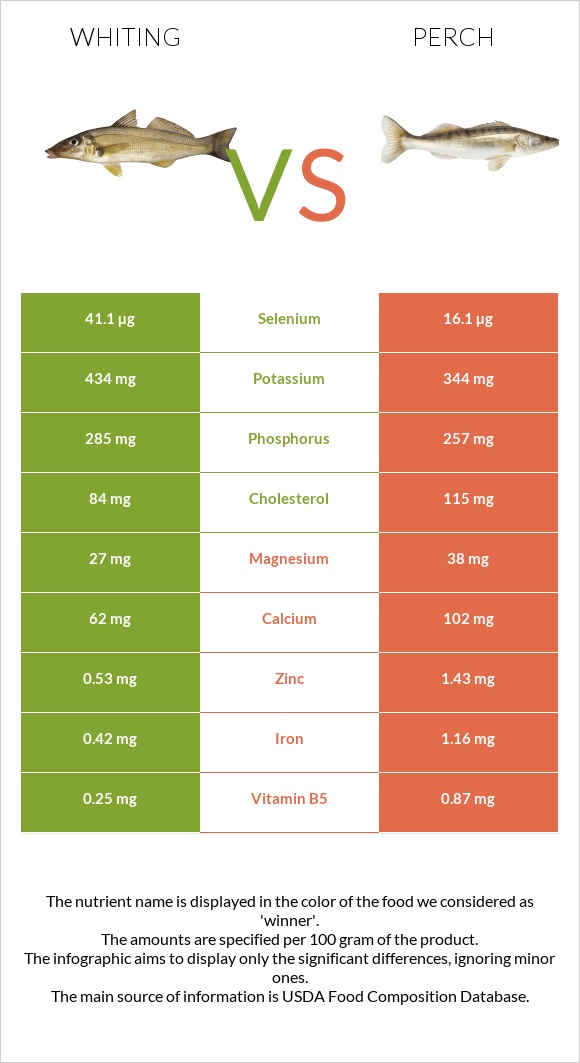
Perch provides more minerals, Vitamin C, B2, B3, and B5. It also has less saturated fat than Pacific whiting. On the other hand, whiting contains more Vitamin D, A, B6, B12, and folate. Also, it has less cholesterol.
Introduction
We'll talk about the main differences between two famous fishes: perch and whiting, focusing on their nutritional content and health impact.
What's The Actual Difference?
Whiting or Pacific whiting belongs to the Merlangius family, while perch is a common name for the fish groups that belong to the Percidae family.
Pacific whiting is a silvery fish with black specks on its back that can grow to about 1.4 pounds and 3 feet long. While perch vary significantly in appearance, they all have a slender body shape, two back fins, and one anal fin. Perch is mild tasting yet sweet, with a moderately firm texture. The flesh of Pacific whiting is soft and mildly sweet.
NUTRITION
The food types discussed in this article are raw perch and raw whiting. To better understand the difference between these two fishes, look at our nutrition infographic at the bottom of the page.
Calories
Both perch and whiting are considered moderate-calories foods.
Perch has 116 calories per 100g, and whiting has 117 calories per 100g.
Minerals
Perch is relatively richer in minerals than whiting. The amount of copper is three times higher.
Moreover, perch is richer in calcium, iron, magnesium, and zinc and has less sodium.
On the other hand, perch contains more phosphorus and potassium.
Mineral Comparison
Contains
more
PotassiumPotassium
+26.2%
Contains
more
SeleniumSelenium
+155.3%
Contains
more
MagnesiumMagnesium
+40.7%
Contains
more
CalciumCalcium
+64.5%
Contains
more
IronIron
+176.2%
Contains
more
CopperCopper
+380%
Contains
more
ZincZinc
+169.8%
Contains
less
SodiumSodium
-40.2%
Contains
more
ManganeseManganese
+592.3%
Vitamins
Perch provides more Vitamin B1, B5, B2, B3, and C than whiting.
Whiting has more Vitamin A, D, B6, B12, and folate.
Both fishes have an equal amount of Vitamin K.
Vitamin Comparison
Contains
more
Vitamin DVitamin D
+∞%
Contains
more
Vitamin AVitamin A
+280%
Contains
more
Vitamin EVitamin E
+∞%
Contains
more
Vitamin B6Vitamin B6
+28.6%
Contains
more
Vitamin B12Vitamin B12
+18.2%
Contains
more
Vitamin KVitamin K
+∞%
Contains
more
FolateFolate
+150%
Contains
more
Vitamin CVitamin C
+∞%
Contains
more
Vitamin B1Vitamin B1
+17.6%
Contains
more
Vitamin B2Vitamin B2
+100%
Contains
more
Vitamin B3Vitamin B3
+13.8%
Contains
more
Vitamin B5Vitamin B5
+248%
Fats
Both fishes have a tiny amount of fat.
Protein
The amounts of protein in perch and whiting are almost equal: perch contains 24.86 g, and whiting has 23.48 g of protein per 100g. Both contain essential amino acids, such as lysine, histidine, and phenylalanine.
Cholesterol
Perch provides more cholesterol than whiting. It has 115 mg of cholesterol per 100g, while whiting provides 84 mg per 100g.
HEALTH IMPACT
Health Benefits
Both perch and whiting are high in omega-3 and omega-6 fatty acids. These two compounds have the potential to improve cardiovascular health, eye health, and immune system function [1]. According to research, omega-3 acids may reduce blood clotting, lower blood pressure and heart failure risk, and decrease triglycerides [2]. One study indicates that omega-3-rich fish bioactive proteins, peptides, or protein hydrolysates have immunomodulatory properties [3].
Another study [4] shows that people who eat more fish have slower rates of mental decline as they age. People who eat two or more meals of fish per week had the lowest rate of mental decline.
References

Infographic
All nutrients comparison - raw data values
| Nutrient | |
|
DV% diff. |
| Selenium | 41.1µg | 16.1µg | 45% |
| Manganese | 0.13mg | 0.9mg | 33% |
| Copper | 0.04mg | 0.192mg | 17% |
| Vitamin B12 | 2.6µg | 2.2µg | 17% |
| Choline | 83.3mg | 15% | |
| Vitamin B5 | 0.25mg | 0.87mg | 12% |
| Cholesterol | 84mg | 115mg | 10% |
| Vitamin D* | 73 IU | 9% | |
| Vitamin D | 1.8µg | 9% | |
| Iron | 0.42mg | 1.16mg | 9% |
| Zinc | 0.53mg | 1.43mg | 8% |
| Vitamin B2 | 0.06mg | 0.12mg | 5% |
| Calcium | 62mg | 102mg | 4% |
| Phosphorus | 285mg | 257mg | 4% |
| Protein | 23.48g | 24.86g | 3% |
| Magnesium | 27mg | 38mg | 3% |
| Potassium | 434mg | 344mg | 3% |
| Vitamin A | 38µg | 10µg | 3% |
| Vitamin E | 0.38mg | 3% | |
| Vitamin B6 | 0.18mg | 0.14mg | 3% |
| Vitamin C | 0mg | 1.7mg | 2% |
| Sodium | 132mg | 79mg | 2% |
| Folate | 15µg | 6µg | 2% |
| Fats | 1.69g | 1.18g | 1% |
| Vitamin B1 | 0.068mg | 0.08mg | 1% |
| Vitamin B3 | 1.67mg | 1.9mg | 1% |
| Saturated fat | 0.4g | 0.237g | 1% |
| Monounsaturated fat | 0.445g | 0.195g | 1% |
| Polyunsaturated fat | 0.587g | 0.472g | 1% |
| Calories | 116kcal | 117kcal | 0% |
| Protein per 100 calories | 20g | 21g | N/A |
| Calories per 10 g protein | 49kcal | 47kcal | N/A |
| Weight per 100 calories | 86g | 85g | N/A |
| Vitamin K | 0.1µg | 0% | |
| Tryptophan | 0.263mg | 0.278mg | 0% |
| Threonine | 1.029mg | 1.09mg | 0% |
| Isoleucine | 1.082mg | 1.145mg | 0% |
| Leucine | 1.908mg | 2.02mg | 0% |
| Lysine | 2.156mg | 2.283mg | 0% |
| Methionine | 0.695mg | 0.736mg | 0% |
| Phenylalanine | 0.917mg | 0.97mg | 0% |
| Valine | 1.21mg | 1.281mg | 0% |
| Histidine | 0.691mg | 0.732mg | 0% |
| Omega-3 - EPA | 0.283g | 0.101g | N/A |
| Omega-3 - DHA | 0.235g | 0.223g | N/A |
| Omega-3 - DPA | 0.017g | 0.036g | N/A |
Macronutrient Comparison
| Contains more FatsFats | +43.2% |
| Contains more OtherOther | +491.7% |
Fat Type Comparison
| Contains more Mono. FatMonounsaturated fat | +128.2% |
| Contains more Poly. FatPolyunsaturated fat | +24.4% |
| Contains less Sat. FatSaturated fat | -40.8% |
People also compare


References
All the values for which the sources are not specified explicitly are taken from FDA’s Food Central. The exact link to the food presented on this page can be found below.
- Whiting - https://fdc.nal.usda.gov/fdc-app.html#/food-details/175161/nutrients
- Perch - https://fdc.nal.usda.gov/fdc-app.html#/food-details/173679/nutrients
All the Daily Values are presented for males aged 31-50, for 2000-calorie diets.