Cornmeal nutrition: calories, carbs, GI, protein, fiber, fats
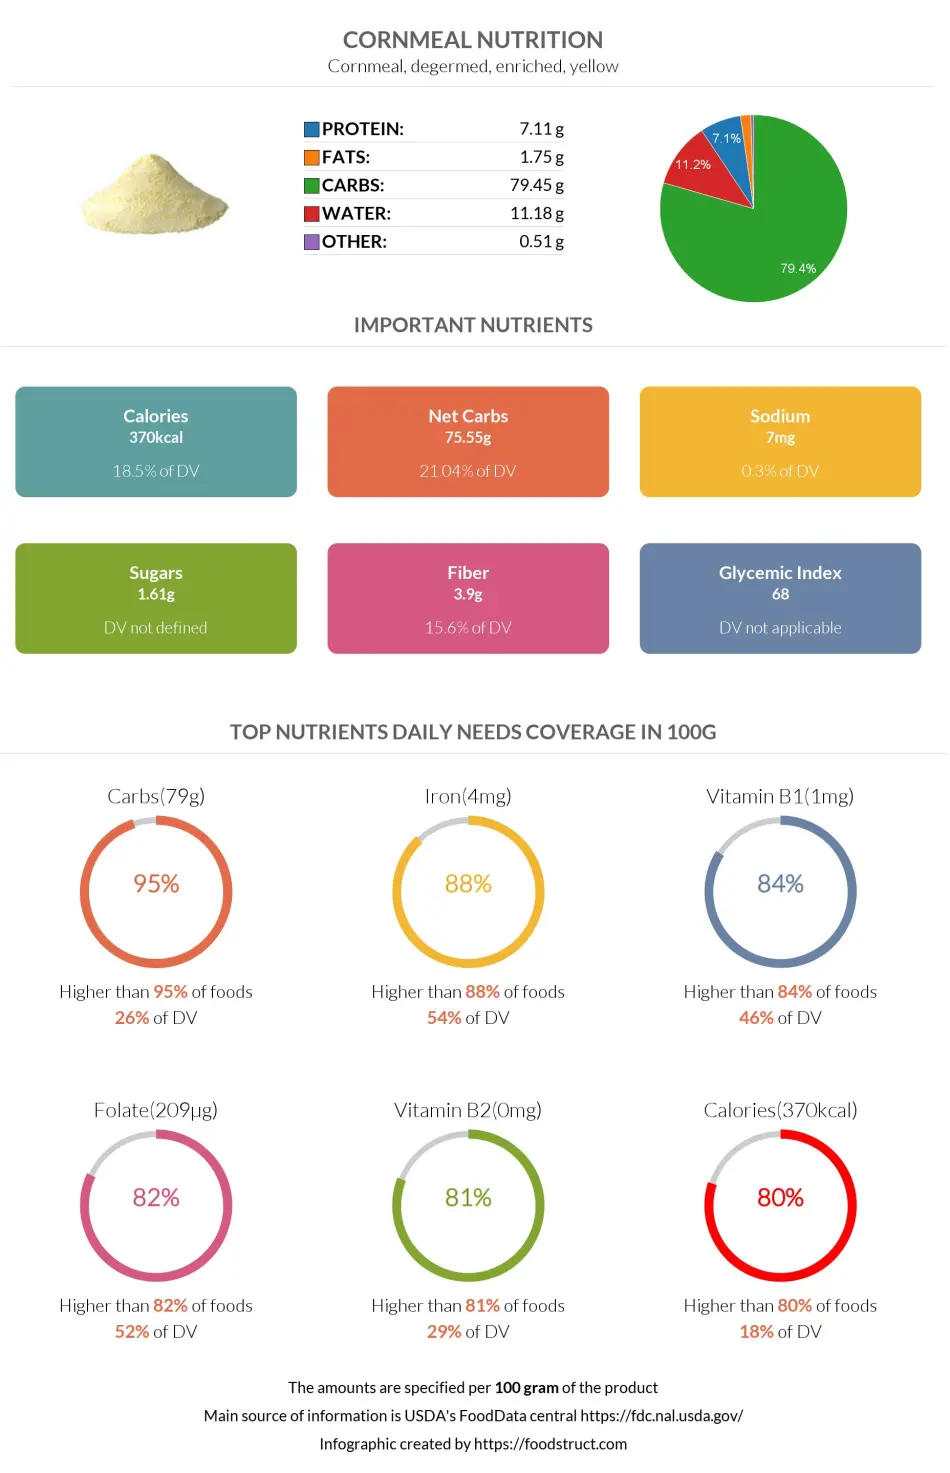
Cornmeal, degermed, enriched, yellow
Top nutrition facts for Cornmeal
| Calories ⓘ Calories for selected serving | 581 kcal |
|
Glycemic index ⓘ
Source: Check out our full article on Cornmeal glycemic index https://www.sciencedirect.com/science/article/pii/S0002916522004944Check out our Glycemic index chart page for the full list.
|
68 (medium) |
| Glycemic load | 81 (high) |
| Net Carbs ⓘ Net Carbs = Total Carbohydrates – Fiber – Sugar Alcohols | 119 grams |
| Default serving size ⓘ Serving sizes are mostly taken from FDA's Reference Amounts Customarily Consumed (RACCs) | 1 cup (157 grams) |
| Acidity (Based on PRAL) ⓘ PRAL (Potential renal acid load) is calculated using a formula. On the PRAL scale the higher the positive value, the more is the acidifying effect on the body. The lower the negative value, the higher the alkalinity of the food. 0 is neutral. | 3.3 (acidic) |
| Oxalates ⓘ https://www.ncbi.nlm.nih.gov/pmc/articles/PMC4525130/ | 85 mg |
Net carbs ⓘHigher in Net carbs content than 96% of foods
Carbs ⓘHigher in Carbs content than 95% of foods
Iron ⓘHigher in Iron content than 88% of foods
Vitamin B1 ⓘHigher in Vitamin B1 content than 84% of foods
Folate ⓘHigher in Folate content than 82% of foods
Cornmeal calories (kcal)
| Calories for different serving sizes of cornmeal | Calories | Weight |
|---|---|---|
| Calories in 100 grams | 370 | |
| Calories in 1 cup | 581 | 157 g |
| Calories for different varieties of cornmeal | Calories | Weight |
|---|---|---|
| Cornmeal, degermed, enriched, yellow (this food) | 370 | 100 g |
| Cornmeal, yellow, self-rising, bolted, plain, enriched | 334 | 100 g |
| Cornmeal, white, self-rising, bolted, plain, enriched | 334 | 100 g |
| Cornmeal, white, self-rising, bolted, with wheat flour added, enriched | 348 | 100 g |
| Cornmeal, white, self-rising, degermed, enriched | 355 | 100 g |
| Cornmeal, whole-grain, yellow | 362 | 100 g |
| Cornmeal, whole-grain, white | 362 | 100 g |
| Cornmeal, degermed, unenriched, yellow | 370 | 100 g |
| Cornmeal, degermed, unenriched, white | 370 | 100 g |
| Cornmeal, yellow (Navajo) | 384 | 100 g |
| Cornmeal, white (Navajo) | 398 | 100 g |
Cornmeal Glycemic index (GI)
Source:
Check out our full article on Cornmeal glycemic index
https://www.sciencedirect.com/science/article/pii/S0002916522004944Check out our Glycemic index chart page for the full list.
Cornmeal Glycemic load (GL)
Mineral coverage chart
Mineral chart - relative view
Vitamin coverage chart
Vitamin A:
52µg of 900µg
5.8%
Vitamin E:
0.57mg of 15mg
3.8%
Vitamin D:
0µg of 20µg
0%
Vitamin C:
0mg of 90mg
0%
Vitamin B1:
2.6mg of 1mg
216%
Vitamin B2:
1.8mg of 1mg
138%
Vitamin B3:
23mg of 16mg
146%
Vitamin B5:
1.1mg of 5mg
23%
Vitamin B6:
0.86mg of 1mg
66%
Folate:
984µg of 400µg
246%
Vitamin B12:
0µg of 2µg
0%
Choline:
41mg of 550mg
7.4%
Vitamin K:
0µg of 120µg
0%
Vitamin chart - relative view
Macronutrients chart
Protein:
Daily Value: 22%
11.2 g of 50 g
11.2 g (22% of DV )
Fats:
Daily Value: 4%
2.7 g of 65 g
2.7 g (4% of DV )
Carbs:
Daily Value: 42%
124.7 g of 300 g
124.7 g (42% of DV )
Water:
Daily Value: 1%
17.6 g of 2,000 g
17.6 g (1% of DV )
Other:
0.8 g
0.8 g
Protein quality breakdown
Tryptophan:
179mg of 280mg
64%
Threonine:
810mg of 1,050mg
77%
Isoleucine:
1140mg of 1,400mg
81%
Leucine:
4738mg of 2,730mg
174%
Lysine:
495mg of 2,100mg
24%
Methionine:
763mg of 1,050mg
73%
Phenylalanine:
1724mg of 1,750mg
99%
Valine:
1587mg of 1,820mg
87%
Histidine:
810mg of 700mg
116%
Fat type information
Saturated fat:
0.35 g
Monounsaturated fat:
0.61 g
Polyunsaturated fat:
1.3 g
Carbohydrate type breakdown
Starch:
115 g
Sucrose:
1.1 g
Glucose:
0.88 g
Fructose:
0.27 g
Lactose:
0 g
Maltose:
0.3 g
Galactose:
0 g
Fiber content ratio for Cornmeal
Sugar:
2.5 g
Fiber:
6.1 g
Other:
116 g
All nutrients for Cornmeal per selected serving size (1 cup - 157g)
| Nutrient | Value | DV% | In TOP % of foods | Comparison |
| Vitamin A | 17µg | 2% | 50% | |
| Calories | 581kcal | 29% | 20% |
7.9 times more than Orange
|
| Protein | 11g | 27% | 53% |
2.5 times more than Broccoli
|
| Fats | 2.7g | 4% | 69% |
19 times less than Cheese
|
| Vitamin C | 0mg | 0% | 100% |
N/A
|
| Net carbs | 119g | N/A | 4% |
1.4 times more than Chocolate
|
| Carbs | 125g | 42% | 5% |
2.8 times more than Rice
|
| Cholesterol | 0mg | 0% | 100% |
N/A
|
| Vitamin D | 0µg | 0% | 100% |
N/A
|
| Magnesium | 50mg | 12% | 30% |
4.4 times less than Almonds
|
| Calcium | 4.7mg | 0% | 95% |
41.7 times less than Milk
|
| Potassium | 223mg | 7% | 72% |
Equal to Cucumber
|
| Iron | 6.8mg | 86% | 12% |
1.7 times more than Beef broiled
|
| Sugar | 2.5g | N/A | 62% |
5.6 times less than Coca-Cola
|
| Fiber | 6.1g | 24% | 22% |
1.6 times more than Orange
|
| Copper | 0.12mg | 13% | 65% |
1.9 times less than Shiitake
|
| Zinc | 1mg | 9% | 63% |
9.6 times less than Beef broiled
|
| Starch | 115g | 47% | 87% |
4.8 times more than Potato
|
| Phosphorus | 155mg | 22% | 64% |
1.8 times less than Chicken meat
|
| Sodium | 11mg | 0% | 87% |
70 times less than White bread
|
| Vitamin E | 0.19mg | 1% | 84% |
12.2 times less than Kiwi
|
| Manganese | 0.27mg | 12% | 53% | |
| Selenium | 16µg | 30% | 59% | |
| Vitamin B1 | 0.87mg | 72% | 16% |
2.1 times more than Pea raw
|
| Vitamin B2 | 0.6mg | 46% | 19% |
2.9 times more than Avocado
|
| Vitamin B3 | 7.8mg | 49% | 33% |
1.9 times less than Turkey meat
|
| Vitamin B5 | 0.38mg | 8% | 78% |
4.7 times less than Sunflower seeds
|
| Vitamin B6 | 0.29mg | 22% | 51% |
1.5 times more than Oats
|
| Vitamin B12 | 0µg | 0% | 100% |
N/A
|
| Vitamin K | 0µg | 0% | 100% |
N/A
|
| Trans fat | 0g | N/A | 100% |
N/A
|
| Folate | 328µg | 82% | 18% |
3.4 times more than Brussels sprouts
|
| Choline | 14mg | 2% | 87% | |
| Saturated fat | 0.35g | 2% | 76% |
26.8 times less than Beef broiled
|
| Monounsaturated fat | 0.61g | N/A | 74% |
25.1 times less than Avocado
|
| Polyunsaturated fat | 1.3g | N/A | 50% |
57 times less than Walnut
|
| Tryptophan | 0.06mg | 0% | 88% |
8 times less than Chicken meat
|
| Threonine | 0.27mg | 0% | 85% |
4.2 times less than Beef broiled
|
| Isoleucine | 0.38mg | 0% | 83% |
3.8 times less than Salmon raw
|
| Leucine | 1.6mg | 0% | 73% |
2.4 times less than Tuna Bluefin
|
| Lysine | 0.16mg | 0% | 91% |
4.3 times less than Tofu
|
| Methionine | 0.25mg | 0% | 78% |
1.7 times more than Quinoa
|
| Phenylalanine | 0.57mg | 0% | 80% |
1.8 times less than Egg
|
| Valine | 0.53mg | 0% | 82% |
6 times less than Soybean raw
|
| Histidine | 0.27mg | 0% | 81% |
4.4 times less than Turkey meat
|
| Fructose | 0.27g | 0% | 91% |
34.7 times less than Apple
|
| Caffeine | 0mg | 0% | 100% | |
| Omega-3 - EPA | 0g | N/A | 100% |
N/A
|
| Omega-3 - DHA | 0g | N/A | 100% |
N/A
|
| Omega-3 - DPA | 0g | N/A | 100% |
N/A
|
| Omega-6 - Gamma-linoleic acid | 0g | N/A | 100% | |
| Omega-6 - Eicosadienoic acid | 0g | N/A | 100% |
Check out similar food or compare with current
NUTRITION FACTS LABEL
Nutrition Facts
___servings per container
Serving Size ______________
Serving Size ______________
Amount Per 100g
Calories 581
% Daily Value*
4.2%
Total Fat
2.7g
1.6%
Saturated Fat 0.35g
0
Trans Fat
0g
0
Cholesterol 0mg
0.48%
Sodium 11mg
42%
Total Carbohydrate
125g
24%
Dietary Fiber
6.1g
Total Sugars 0g
Includes ? g Added Sugars
Protein
11g
Vitamin D
0mcg
0
Calcium
4.7mg
0.47%
Iron
6.8mg
86%
Potassium
223mg
6.6%
*
The % Daily Value (DV) tells you how much a nutrient in a serving of food contributes to a daily diet. 2,000 calories a day is used for general nutrition advice.
Health checks
ⓘ
Dietary cholesterol is not associated with an increased risk of coronary heart disease in healthy individuals. However, dietary cholesterol is common in foods that are high in harmful saturated fats.
Source
Low in Cholesterol
ⓘ
Trans fat consumption increases the risk of cardiovascular disease and mortality by negatively affecting blood lipid levels.
Source
No Trans Fats
ⓘ
Saturated fat intake can raise total cholesterol and LDL (low-density lipoprotein) levels, leading to an increased risk of atherosclerosis. Dietary guidelines recommend limiting saturated fats to under 10% of calories a day.
Source
Low in Saturated Fats
ⓘ
While the consumption of moderate amounts of added sugars is not detrimental to health, an excessive intake can increase the risk of obesity, and therefore, diabetes.
Source
Low in Sugars
Cornmeal nutrition infographic
Infographic link
References
All the values for which the sources are not specified explicitly are taken from FDA’s Food Central. The exact link to the food presented on this page can be found below.