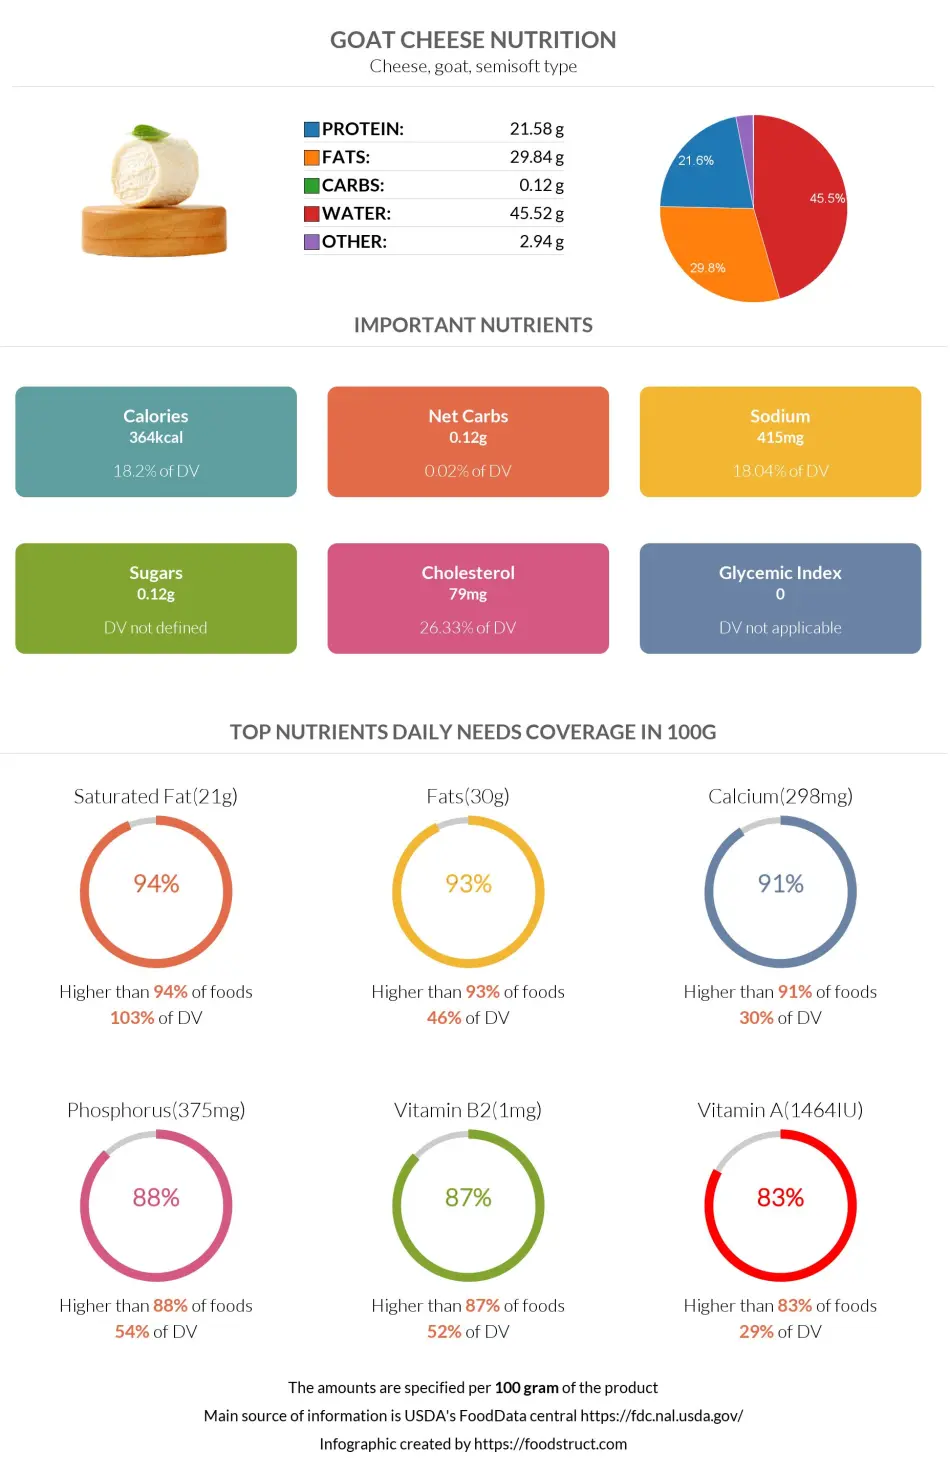
Goat cheese nutrition: calories, carbs, GI, protein, fiber, fats
Cheese, goat, semisoft type
Important nutritional characteristics for Goat cheese

| Glycemic index ⓘ Goat cheese can be considered as a 0 glycemic index food as it does not have carbs. Source: https://foodstruct.com/articles/glycemic-index-of-0-no-carb-foods | 0 (low) |
| Calories ⓘ Calories for selected serving | 103 kcal |
| Net Carbs ⓘ Net Carbs = Total Carbohydrates – Fiber – Sugar Alcohols | 0 grams |
| Default serving size ⓘ Serving sizes are mostly taken from FDA's Reference Amounts Customarily Consumed (RACCs) | 1 oz (28.35 grams) |
| Acidity (Based on PRAL) ⓘ PRAL (Potential renal acid load) is calculated using a formula. On the PRAL scale the higher the positive value, the more is the acidifying effect on the body. The lower the negative value, the higher the alkalinity of the food. 0 is neutral. | 16.5 (acidic) |
| Oxalates ⓘ Animal products do not contain oxalate. | 0 mg |
Saturated Fat ⓘHigher in Saturated Fat content than 94% of foods
Fats ⓘHigher in Fats content than 93% of foods
Calcium ⓘHigher in Calcium content than 91% of foods
Phosphorus ⓘHigher in Phosphorus content than 88% of foods
Vitamin B2 ⓘHigher in Vitamin B2 content than 87% of foods
Goat cheese calories (kcal)
| Serving Size | Calories | Weight |
|---|---|---|
| Calories in 100 grams | 364 | |
| Calories in 1 oz | 103 | 28.35 g |
Goat cheese Glycemic index (GI)
Goat cheese can be considered as a 0 glycemic index food as it does not have carbs. Source: https://foodstruct.com/articles/glycemic-index-of-0-no-carb-foods
Mineral coverage chart
Mineral chart - relative view
Vitamin coverage chart
Vitamin A:
1245IU of 5,000IU
25%
Vitamin E :
0.22mg of 15mg
1.5%
Vitamin D:
0.43µg of 10µg
4.3%
Vitamin C:
0mg of 90mg
0%
Vitamin B1:
0.06mg of 1mg
5.1%
Vitamin B2:
0.57mg of 1mg
44%
Vitamin B3:
0.98mg of 16mg
6.1%
Vitamin B5:
0.16mg of 5mg
3.2%
Vitamin B6:
0.05mg of 1mg
3.9%
Folate:
1.7µg of 400µg
0.43%
Vitamin B12:
0.19µg of 2µg
7.8%
Choline:
13mg of 550mg
2.4%
Vitamin K:
2.1µg of 120µg
1.8%
Vitamin chart - relative view
Vitamin D
0.14 µg
TOP 48%
Macronutrients chart
Protein:
Daily Value: 12%
6.1 g of 50 g
6.1 g (12% of DV )
Fats:
Daily Value: 13%
8.5 g of 65 g
8.5 g (13% of DV )
Carbs:
Daily Value: 0%
0 g of 300 g
0 g (0% of DV )
Water:
Daily Value: 1%
12.9 g of 2,000 g
12.9 g (1% of DV )
Other:
0.8 g
0.8 g
Protein quality breakdown
Tryptophan:
193mg of 280mg
69%
Threonine:
685mg of 1,050mg
65%
Isoleucine:
759mg of 1,400mg
54%
Leucine:
1583mg of 2,730mg
58%
Lysine:
1317mg of 2,100mg
63%
Methionine:
489mg of 1,050mg
47%
Phenylalanine:
731mg of 1,750mg
42%
Valine:
1263mg of 1,820mg
69%
Histidine:
501mg of 700mg
72%
Fat type information
Saturated Fat:
5.9 g
Monounsaturated Fat:
1.9 g
Polyunsaturated fat:
0.2 g
Fiber content ratio for Goat cheese
Sugar:
0.03 g
Fiber:
0 g
Other:
0 g
All nutrients for Goat cheese per selected serving size (1 oz - 28.35g)
| Nutrient | Value | DV% | In TOP % of foods | Comparison |
| Calories | 103kcal | 5% | 21% |
7.7 times more than Orange
|
| Protein | 6.1g | 15% | 20% |
7.7 times more than Broccoli
|
| Fats | 8.5g | 13% | 7% |
1.1 times less than Cheese
|
| Vitamin C | 0mg | 0% | 100% |
N/A
|
| Net carbs | 0.03g | N/A | 74% |
451.4 times less than Chocolate
|
| Carbs | 0.03g | 0% | 74% |
234.8 times less than Rice
|
| Cholesterol | 22mg | 7% | 22% |
4.7 times less than Egg
|
| Vitamin D | 0.14µg | 1% | 48% |
4.4 times less than Egg
|
| Magnesium | 8.2mg | 2% | 34% |
4.8 times less than Almond
|
| Calcium | 84mg | 8% | 9% |
2.4 times more than Milk
|
| Potassium | 45mg | 1% | 69% |
1.1 times more than Cucumber
|
| Iron | 0.46mg | 6% | 45% |
1.6 times less than Beef broiled
|
| Sugar | 0.03g | N/A | 75% |
74.8 times less than Coca-Cola
|
| Fiber | 0g | 0% | 100% |
N/A
|
| Copper | 0.16mg | 18% | 19% |
4 times more than Shiitake
|
| Zinc | 0.19mg | 2% | 63% |
9.6 times less than Beef broiled
|
| Phosphorus | 106mg | 15% | 12% |
2.1 times more than Chicken meat
|
| Sodium | 118mg | 5% | 25% |
1.2 times less than White Bread
|
| Vitamin A | 415IU | 8% | 17% |
11.4 times less than Carrot
|
| Vitamin A RAE | 115µg | 13% | 22% | |
| Vitamin E | 0.07mg | 0% | 70% |
5.6 times less than Kiwifruit
|
| Selenium | 1.1µg | 2% | 70% | |
| Manganese | 0.03mg | 1% | 61% | |
| Vitamin B1 | 0.02mg | 2% | 60% |
3.7 times less than Pea raw
|
| Vitamin B2 | 0.19mg | 15% | 13% |
5.2 times more than Avocado
|
| Vitamin B3 | 0.33mg | 2% | 67% |
8.3 times less than Turkey meat
|
| Vitamin B5 | 0.05mg | 1% | 82% |
5.9 times less than Sunflower seed
|
| Vitamin B6 | 0.02mg | 1% | 75% |
2 times less than Oat
|
| Vitamin B12 | 0.06µg | 3% | 58% |
3.2 times less than Pork
|
| Vitamin K | 0.71µg | 1% | 62% |
40.6 times less than Broccoli
|
| Folate | 0.57µg | 0% | 90% |
30.5 times less than Brussels sprout
|
| Saturated Fat | 5.9g | 29% | 6% |
3.5 times more than Beef broiled
|
| Choline | 4.4mg | 1% | 80% | |
| Monounsaturated Fat | 1.9g | N/A | 23% |
1.4 times less than Avocado
|
| Polyunsaturated fat | 0.2g | N/A | 53% |
66.5 times less than Walnut
|
| Tryptophan | 0.06mg | 0% | 60% |
1.3 times less than Chicken meat
|
| Threonine | 0.23mg | 0% | 65% |
1.1 times more than Beef broiled
|
| Isoleucine | 0.25mg | 0% | 63% |
Equal to Salmon raw
|
| Leucine | 0.53mg | 0% | 56% |
1.3 times less than Tuna Bluefin
|
| Lysine | 0.44mg | 0% | 65% |
3.4 times more than Tofu
|
| Methionine | 0.16mg | 0% | 60% |
6 times more than Quinoa
|
| Phenylalanine | 0.24mg | 0% | 60% |
1.3 times more than Egg
|
| Valine | 0.42mg | 0% | 46% |
1.4 times less than Soybean raw
|
| Histidine | 0.17mg | 0% | 65% |
1.3 times less than Turkey meat
|
| Omega-3 - EPA | 0g | N/A | 100% |
N/A
|
| Omega-3 - DHA | 0g | N/A | 100% |
N/A
|
| Omega-3 - DPA | 0g | N/A | 100% |
N/A
|
Check out similar food or compare with current
NUTRITION FACTS LABEL
Nutrition Facts
___servings per container
Serving Size ______________
Serving Size ______________
Amount Per 100g
Calories 103
% Daily Value*
13%
Total Fat
8.5g
27%
Saturated Fat 5.9g
0
Trans Fat
0g
7.5%
Cholesterol 22mg
5.1%
Sodium 118mg
0.01%
Total Carbohydrate
0.03g
0
Dietary Fiber
0g
Total Sugars 0g
Includes ? g Added Sugars
Protein
6.1g
Vitamin D
6.2mcg
1%
Calcium
84mg
8.4%
Iron
0.46mg
5.7%
Potassium
45mg
1.3%
*
The % Daily Value (DV) tells you how much a nutrient in a serving of food contributes to a daily diet. 2,000 calories a day is used for general nutrition advice.
Health checks
ⓘ
Dietary cholesterol is not associated with an increased risk of coronary heart disease in healthy individuals. However, dietary cholesterol is common in foods that are high in harmful saturated fats.
Source
Low in Cholesterol
ⓘ
Trans fat consumption increases the risk of cardiovascular disease and mortality by negatively affecting blood lipid levels.
Source
No Trans Fats
ⓘ
Saturated fat intake can raise total cholesterol and LDL (low-density lipoprotein) levels, leading to an increased risk of atherosclerosis. Dietary guidelines recommend limiting saturated fats to under 10% of calories a day.
Source
Low in Saturated Fats
ⓘ
While the consumption of moderate amounts of added sugars is not detrimental to health, an excessive intake can increase the risk of obesity, and therefore, diabetes.
Source
Low in Sugars
Goat cheese nutrition infographic
Infographic link
References
All the values for which the sources are not specified explicitly are taken from FDA’s Food Central. The exact link to the food presented on this page can be found below.