Peanut Nutrition & Calories - Complete Data of All Nutrients
Summary
In a few words, peanuts are incredibly rich in nutrients, such as proteins, fats, and fiber, while being low in net carbs. In micronutrient content, peanuts are an excellent source of copper, manganese, iron, vitamin E, and B complex vitamins.
Peanuts are also full of phytochemicals with antioxidant properties and various health-beneficial effects.
Peanuts are high in oxalates, containing 76mg per 100g serving. Roasted peanuts contain nearly 2.5 times more oxalates.
Introduction
Nuts are widely known for being incredibly dense in nutrients with varying health benefits. In this article, we will delve into the nutrition of peanuts and discuss everything you should know about it.
Peanuts are not botanically true nuts but legumes used as culinary nuts. Peanuts are also known as groundnut, goober, pindar, or monkey nut.
Nutrition
In this article, we will focus on the nutrition of raw peanuts of all types. We will also look into the nutritional compositions of oil-roasted and boiled peanuts with salt (1, 2).
Additionally, the notable nutritional differences between the three main cultivars of peanuts will be mentioned: Valencia, Spanish, and Virginia (3, 4, 5).
The average serving size of peanuts per person is 1 ounce or 28.35g.
Nutrient Density
Peanuts are incredibly nutritionally dense, consisting of 93% nutrients and only 7% water.
Valencia variety peanuts are a little richer in nutrients, containing 4% water.
Roasted peanuts lose water and contain only 1.5% of it, while boiled peanuts are less dense in nutrients overall, consisting of 42% water.
Macronutrients chart
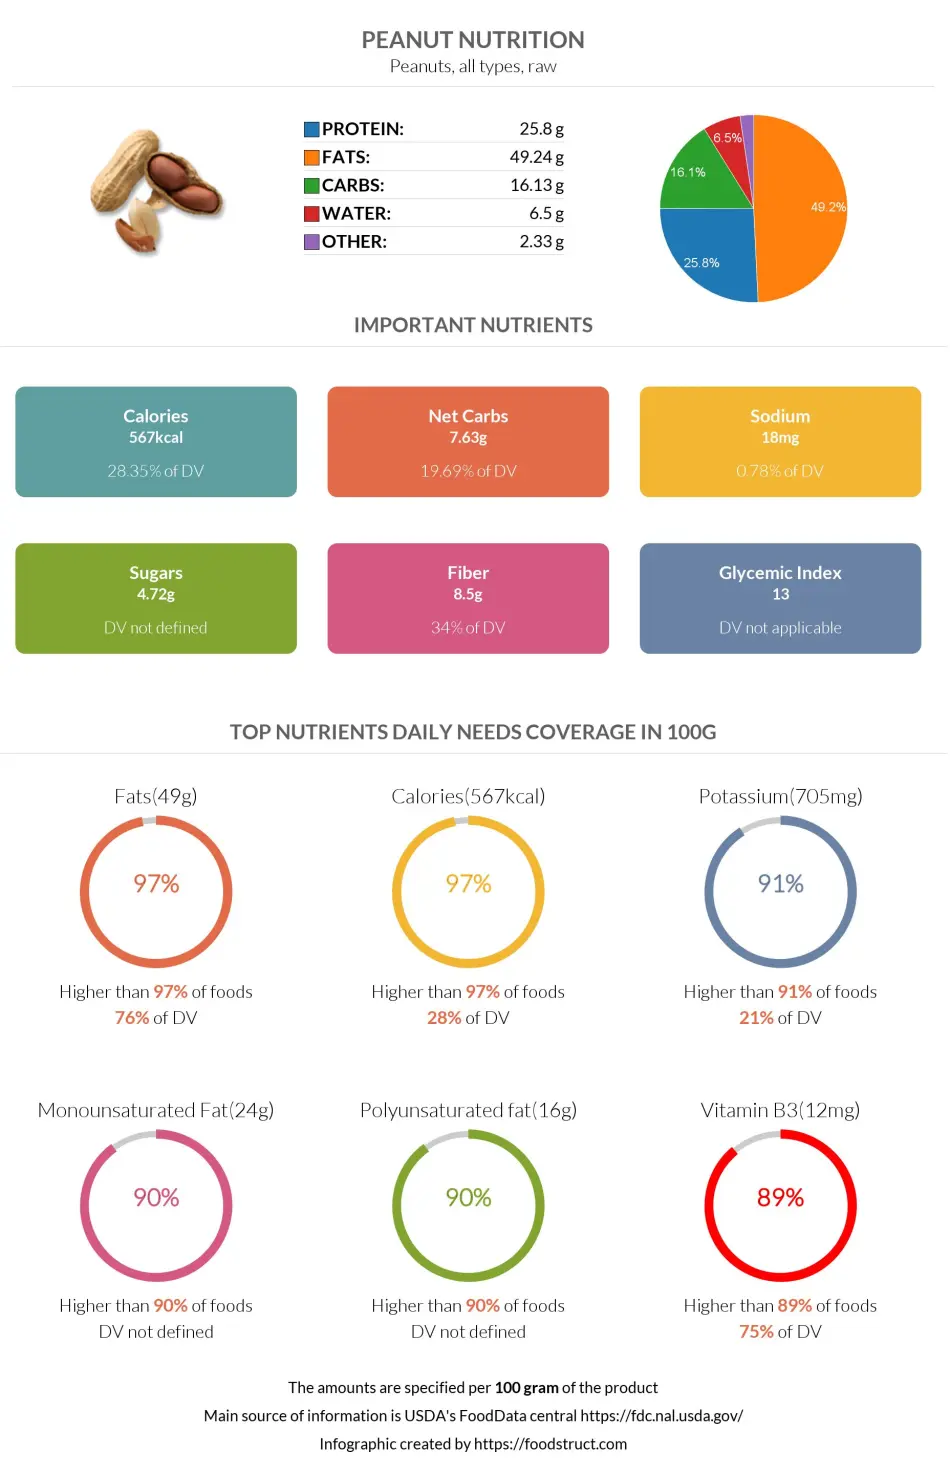
Calories
Peanuts provide a lot of energy, being so dense in nutrients. A 100g serving of peanuts provides 567 calories.
Consequently, one serving size of peanuts provides 161 calories.
A 100g of roasted peanuts contains 600 calories, while boiled peanuts are significantly lower in calories: 318 per 100g of the product.
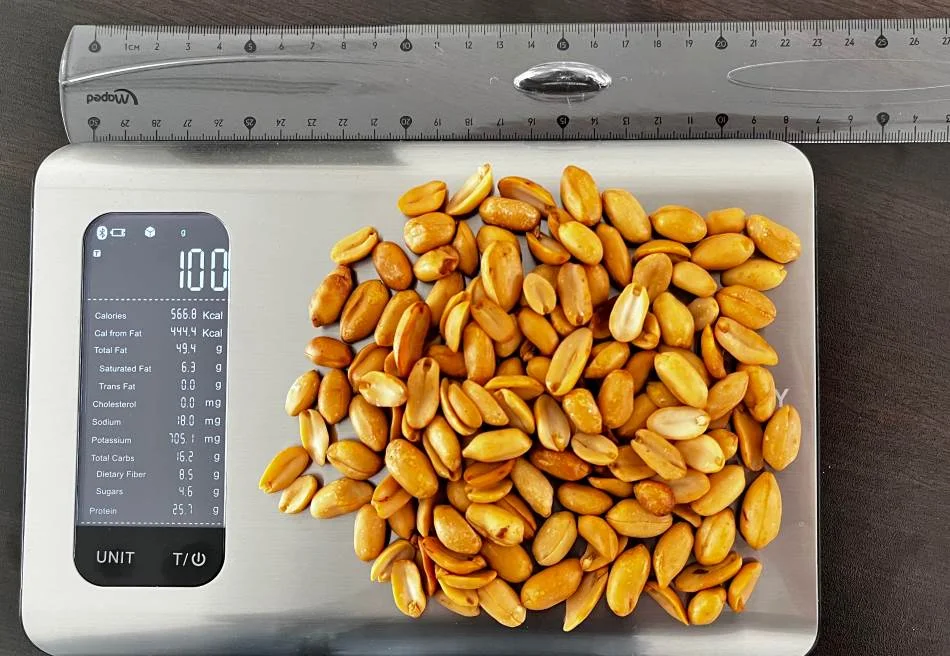
What Do 576 Calories or 100 Grams of Peanuts Look Like?
"We measured what 100 grams of peanuts looks like to help you visualize their weight and calories. The picture below shows that about 112 peanuts make up 100 grams or 576 calories, meaning that one serving of peanuts (28.35g) is about 160 calories.
Protein
Peanuts are so rich in nutrients that a 100g serving size of these nuts can provide more than half of the recommended daily value for proteins.
Research shows peanut proteins are nutritionally equivalent to meat and eggs for human health (6). This makes peanuts an excellent choice of protein for vegans and vegetarians.
A 100g serving of peanuts has 25.8g of protein. Accordingly, one average serving size of peanuts provides 7.3g of protein.
Peanuts are particularly rich in the amino acid arginine.
Roasted peanuts are richer in protein, in comparison, boiled peanuts contain half the amount.
Essential Amino Acids
The protein found in peanuts is of high quality, containing satisfactory amounts of all essential amino acids.
Peanuts are particularly richer in histidine, tryptophan, and threonine while being relatively lower in methionine and lysine.
Protein quality breakdown
Carbohydrates
Peanuts are not very high in carbohydrates, as a 100g serving provides only 5% of the recommended daily value of carbohydrates.
A 100g serving size contains 16g of carbohydrates, almost 2 times less than rice.
Compared to the Spanish and Virginia varieties, Valencia is richer in carbohydrates.
Interestingly, boiled peanuts are higher in carbohydrates than roasted peanuts.
Net Carbs
The net carbs make up less than half of the overall carb content.
A 100g serving of peanuts provides 7.63g of net carbs. Consequently, one serving size contains only 2g of net carbs.
Of these carbs, 62% are comprised of sugars and 38% are comprised of other carbs, such as starch.
Dietary Fiber
Dietary fiber makes up about 53% of peanuts’ carb content. Peanuts are in the top 13% of foods as a source of fiber, providing 8.5g of it per 100g serving.
A 100g of peanuts covers 34% of the recommended daily value of fiber.
The Spanish variety is relatively richer in dietary fiber.
The fiber found in peanuts consists of 94% insoluble and only 6% soluble fiber (7).
Fiber content ratio for Peanut
Fats
Fat is one of the major nutrients found in peanuts. Almost half of the peanut’s mass is made up of fats.
100g of peanuts covers around 75% of the recommended daily value of fats. One serving size (1 oz) of peanuts contains 14g of fats.
Boiled peanuts are significantly lower in fats.
The fat content of peanuts consists of 53% monounsaturated, 34% polyunsaturated, and 13% saturated fats. Many researchers consider monounsaturated and polyunsaturated fats heart-healthy.
The Spanish variety has a more favorable fat composition than other cultivars.
Fat type information
Monounsaturated Fats
The monounsaturated fat content consists almost entirely of oleic acid (8). Research has found that this compound improves the immune system and reduces central obesity (9, 10).
Polyunsaturated Fats
Peanuts’ polyunsaturated fats are made of omega-6 linoleic fatty acid, containing a negligible amount of omega-3 fatty acids.
Linoleic acid intake has been associated with a reduced incidence of cardiovascular disease and type 2 diabetes (11).
Saturated Fats
The saturated fat content of peanuts is comprised of about 82% palmitic acid (5.15g), 17.5% stearic acid (1.1g), and 0.5% myristic acid (0.025g).
Along with polyunsaturated fats, palmitic acid plays an important role in the proper function of the human body. However, combined with excessive carbohydrate intake and a sedentary lifestyle, palmitic acid can have adverse health effects (12).
Cholesterol
As a plant-based food, peanuts naturally do not contain cholesterol.
Vitamins
Peanuts are an excellent source of B-complex vitamins and vitamin E.
A 100g serving of peanuts covers the daily recommended value for vitamin B3 by 75%, vitamin B9 or folate by 60%, vitamin B1 by 53%, and vitamin E by 56%.
B-complex vitamins participate in energy metabolism, DNA synthesis and repair, and synthesis of various neurochemicals and signaling molecules required for the normal functioning of organ systems. They are also required for adequate immune response (13, 14).
Vitamin E, abundant in peanuts, is a fat-soluble vitamin with antioxidant activity; thus, it protects the cells from harmful free radicals and reduces the risk of developing heart disease and cancer (15).
Peanuts also contain moderate levels of vitamins B2, B5, and B6. Peanuts completely lack water-soluble vitamin C and vitamin B12 and fat-soluble vitamins A, D, and K.
Vitamin coverage chart
Minerals
Peanuts are rich in almost all minerals.
A 100g serving of peanuts provides even more than the recommended daily amount of copper.
Peanuts are in the top 12% of foods as a source of magnesium, iron, and phosphorus. These nuts are also incredibly rich in calcium, manganese, and zinc while containing moderate levels of selenium and choline.
Mineral coverage chart
Peanuts also contain a nutritionally significant amount of the chromium element (16).
Sodium
Peanuts without added salt are low in sodium, containing only 18mg per 100g serving.
In contrast, 100g of oil-roasted salted peanuts contain 320mg of sodium, while boiled peanuts with salt provide almost 2.5 times more sodium (751mg).
For reference, the recommended amount of sodium is less than 2300mg daily (17).
Oxalates
Oxalates or oxalic acids are compounds in most nuts, vegetables, fruits, and grains. Oxalate consumption is safe for most people; however, people at risk of developing calcium oxalate kidney stones should avoid foods high in oxalates.
Peanuts are high in oxalates, containing 76mg per 100g serving. Roasted peanuts contain nearly 2.5 times more oxalates: 187mg per 100g serving (18, 19).
Phytochemicals
Polyphenolic Compounds
Peanuts are a great source of polyphenolic compounds, such as resveratrol, polyphenolic acids, isoflavones, and flavonoids. These strong antioxidant compounds can reduce the risk of heart disease, cancer, and degenerative nerve disease by preventing cell damage (20).
Phytosterols
Phytosterols or plant sterols reduce cholesterol absorption into the bloodstream by being structurally similar to cholesterol.
Due to this function, phytosterols can help decrease the risk of cardiovascular disease (21).
Peanuts and peanut products are particularly rich in phytosterols such as beta-sitosterol, campesterol, and stigmasterol. These compounds may also reduce inflammation and cancer risk (22).
Glycemic Index
The exact number for the glycemic index of peanuts depends on the variety and cooking method. However, all of those numbers fall in the low glycemic index category.
Boiled peanuts from the Philippines had the lowest glycemic index value of 5. Meanwhile, peanuts from Mexico had the highest glycemic index value of 23 (23).
That being said, the average glycemic index value of peanuts can be considered to be 13 (24).
Insulin Index
Food's insulin index shows how much it raises blood insulin levels in the first few hours after consumption.
The insulin index for salted roasted peanuts has been researched to be 20±5 (25).
Acidity
Peanuts have a close to neutral acidity. Raw peanuts have a pH value 6.9, while roasted peanuts’ pH value is about 6.3 (26).
The potential renal acid load or PRAL measures how much base or acid the given food produces inside the body. The PRAL value for peanuts is 6.2, making it an acid-producing food.
Comparison to Similar Foods
Peanuts are richer in protein compared to other legumes and grains, including kidney beans, chickpeas, pinto beans, soybean flour, wheat flour, and rice (22).
Peanuts contain 9 times more protein than broccoli.
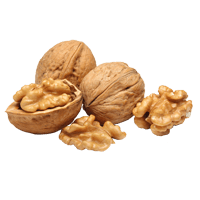
Peanuts are also richer in proteins compared to other nuts, such as cashews, almonds, walnuts, pecans, and pistachios (20).
Peanuts are 2.5 times richer in monounsaturated fats than avocados but contain 3 times less polyunsaturated fats than walnuts.
Peanuts are higher in vitamin B3, vitamin E, and choline compared to most other nuts and soybeans (20).
If interested, you can find complete in-depth comparisons of “Peanut vs. Cashew,” “Peanut vs. Almond,” “Peanut vs. Pecan,” and “Peanut vs. Walnut.”
References
- https://fdc.nal.usda.gov/fdc-app.html#/food-details/174261/nutrients
- https://fdc.nal.usda.gov/fdc-app.html#/food-details/174260/nutrients
- https://fdc.nal.usda.gov/fdc-app.html#/food-details/172432/nutrients
- https://fdc.nal.usda.gov/fdc-app.html#/food-details/174263/nutrients
- https://fdc.nal.usda.gov/fdc-app.html#/food-details/172434/nutrients
- https://pubmed.ncbi.nlm.nih.gov/18330140/
- https://www.ncbi.nlm.nih.gov/pmc/articles/PMC3614039/
- https://www.scirp.org/pdf/FNS20121200005_45452645.pdf
- https://pubmed.ncbi.nlm.nih.gov/23278117/
- https://pubmed.ncbi.nlm.nih.gov/32135008/
- https://pubmed.ncbi.nlm.nih.gov/31785494/
- https://www.ncbi.nlm.nih.gov/pmc/articles/PMC5682332/
- https://www.ncbi.nlm.nih.gov/pmc/articles/PMC4772032/
- https://pubmed.ncbi.nlm.nih.gov/30779018/
- https://ods.od.nih.gov/factsheets/VitaminE-HealthProfessional/
- https://pubmed.ncbi.nlm.nih.gov/3604298/
- https://www.fda.gov/food/nutrition-education-resources-materials/sodium-your-diet
- https://www.sciencedirect.com/science/article/abs/pii/S0889157513000902
- https://www.ncbi.nlm.nih.gov/pmc/articles/PMC4714167
- https://www.sciencedirect.com/science/article/pii/S2213453019301004
- https://pubmed.ncbi.nlm.nih.gov/20067836
- https://www.ncbi.nlm.nih.gov/pmc/articles/PMC4711439/
- https://academic.oup.com/ajcn/article/114/5/1625/6320814
- https://www.ijmrhs.com/medical-research/dry-fruits-and-diabetes-mellitus.pdf
- https://academic.oup.com/ajcn/article/66/5/1264/4655967
- http://www.nphsystem.guide/nut_seed_values.htm

Top nutrition facts for Peanut
| Calories ⓘ Calories for selected serving | 828 kcal |
|
Glycemic index ⓘ
Source:
Check out our Glycemic index chart page for the full list.
|
13 (low) |
| Insulin index ⓘ https://academic.oup.com/ajcn/article/66/5/1264/4655967 – 20 | 20 |
| Net Carbs ⓘ Net Carbs = Total Carbohydrates – Fiber – Sugar Alcohols | 11 grams |
| Default serving size ⓘ Serving sizes are mostly taken from FDA's Reference Amounts Customarily Consumed (RACCs) | 1 oz (28.35 grams) |
| Acidity (Based on PRAL) ⓘ PRAL (Potential renal acid load) is calculated using a formula. On the PRAL scale the higher the positive value, the more is the acidifying effect on the body. The lower the negative value, the higher the alkalinity of the food. 0 is neutral. | 6.2 (acidic) |
| Oxalates ⓘ https://www.sciencedirect.com/science/article/abs/pii/S0889157513000902 | 111 mg |
Peanut calories (kcal)
| Calories for different serving sizes of peanut | Calories | Weight |
|---|---|---|
| Calories in 100 grams | 567 | |
| Calories in 1 oz | 161 | 28.35 g |
| Calories in 1 cup | 828 | 146 g |
| Calories for different varieties of peanut | Calories | Weight |
|---|---|---|
| Peanuts, all types, raw (this food) | 567 | 100 g |
| Peanuts, all types, cooked, boiled, with salt | 318 | 100 g |
| Peanuts, all types, dry-roasted, with salt | 587 | 100 g |
| Peanuts, all types, dry-roasted, without salt | 587 | 100 g |
| Peanuts, all types, oil-roasted, with salt | 599 | 100 g |
| Peanuts, all types, oil-roasted, without salt | 599 | 100 g |
Peanut Glycemic index (GI)
Mineral chart - relative view
Vitamin chart - relative view
All nutrients for Peanut per selected serving size (1 cup - 146g)
| Nutrient | Value | DV% | In TOP % of foods | Comparison |
| Vitamin A | 0µg | 0% | 100% | |
| Calories | 828kcal | 41% | 3% |
12.1 times more than Orange
|
| Protein | 38g | 90% | 12% |
9.1 times more than Broccoli
|
| Fats | 72g | 111% | 3% |
1.5 times more than Cheese
|
| Vitamin C | 0mg | 0% | 100% |
N/A
|
| Net carbs | 11g | N/A | 50% |
7.1 times less than Chocolate
|
| Carbs | 24g | 8% | 39% |
1.7 times less than Rice
|
| Cholesterol | 0mg | 0% | 100% |
N/A
|
| Vitamin D | 0µg | 0% | 100% |
N/A
|
| Magnesium | 245mg | 58% | 11% |
1.2 times more than Almonds
|
| Calcium | 134mg | 13% | 24% |
1.4 times less than Milk
|
| Potassium | 1029mg | 30% | 9% |
4.8 times more than Cucumber
|
| Iron | 6.7mg | 84% | 12% |
1.8 times more than Beef broiled
|
| Sugar | 6.9g | N/A | 49% |
1.9 times less than Coca-Cola
|
| Fiber | 12g | 50% | 13% |
3.5 times more than Orange
|
| Copper | 1.7mg | 186% | 16% |
8.1 times more than Shiitake
|
| Zinc | 4.8mg | 43% | 28% |
1.9 times less than Beef broiled
|
| Phosphorus | 549mg | 78% | 12% |
2.1 times more than Chicken meat
|
| Sodium | 26mg | 1% | 82% |
27.2 times less than White bread
|
| Vitamin E | 12mg | 81% | 35% |
5.7 times more than Kiwi
|
| Manganese | 2.8mg | 123% | 28% | |
| Selenium | 11µg | 19% | 64% | |
| Vitamin B1 | 0.93mg | 78% | 14% |
2.4 times more than Pea raw
|
| Vitamin B2 | 0.2mg | 15% | 61% |
Equal to Avocado
|
| Vitamin B3 | 18mg | 110% | 11% |
1.3 times more than Turkey meat
|
| Vitamin B5 | 2.6mg | 52% | 28% |
1.6 times more than Sunflower seeds
|
| Vitamin B6 | 0.51mg | 39% | 36% |
2.9 times more than Oats
|
| Vitamin B12 | 0µg | 0% | 100% |
N/A
|
| Vitamin K | 0µg | 0% | 100% |
N/A
|
| Folate | 350µg | 88% | 18% |
3.9 times more than Brussels sprouts
|
| Trans fat | 0g | N/A | 100% |
N/A
|
| Saturated fat | 9.2g | 46% | 20% |
1.1 times more than Beef broiled
|
| Choline | 77mg | 14% | 65% | |
| Monounsaturated fat | 36g | N/A | 10% |
2.5 times more than Avocado
|
| Polyunsaturated fat | 23g | N/A | 10% |
3 times less than Walnut
|
| Tryptophan | 0.37mg | 0% | 57% |
1.2 times less than Chicken meat
|
| Threonine | 1.3mg | 0% | 61% |
1.2 times more than Beef broiled
|
| Isoleucine | 1.3mg | 0% | 63% |
Equal to Salmon raw
|
| Leucine | 2.4mg | 0% | 61% |
1.5 times less than Tuna Bluefin
|
| Lysine | 1.4mg | 0% | 72% |
2 times more than Tofu
|
| Methionine | 0.46mg | 0% | 71% |
3.3 times more than Quinoa
|
| Phenylalanine | 2mg | 0% | 43% |
2.1 times more than Egg
|
| Valine | 1.6mg | 0% | 59% |
1.9 times less than Soybean raw
|
| Histidine | 0.95mg | 0% | 62% |
1.1 times less than Turkey meat
|
| Caffeine | 0mg | 0% | 100% | |
| Omega-3 - EPA | 0g | N/A | 100% |
N/A
|
| Omega-3 - DHA | 0g | N/A | 100% |
N/A
|
| Omega-3 - DPA | 0g | N/A | 100% |
N/A
|
Check out similar food or compare with current
NUTRITION FACTS LABEL
Serving Size ______________
Health checks
Peanut nutrition infographic
References
All the values for which the sources are not specified explicitly are taken from FDA’s Food Central. The exact link to the food presented on this page can be found below.