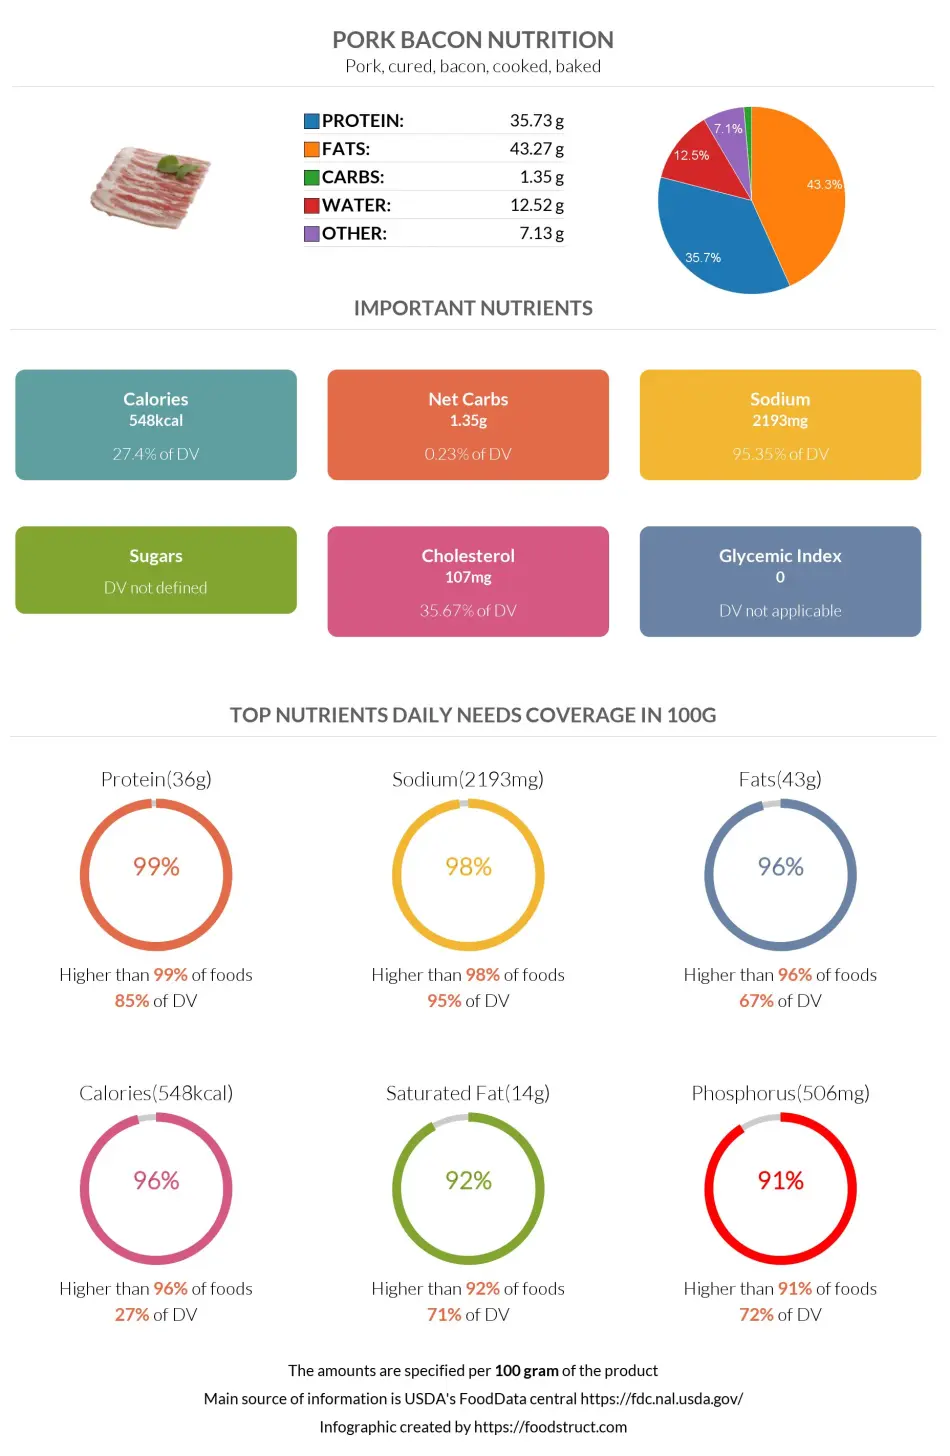
Pork bacon nutrition: calories, carbs, GI, protein, fiber, fats
Pork, cured, bacon, cooked, baked
Top nutrition facts for Pork bacon

| Calories ⓘ Calories for selected serving | 548 kcal |
|
Glycemic index ⓘ
Source:
Check out our Glycemic index chart page for the full list.
|
0 (low) |
| Insulin index ⓘ https://pubmed.ncbi.nlm.nih.gov/21325437/ | 9 |
| Net Carbs ⓘ Net Carbs = Total Carbohydrates – Fiber – Sugar Alcohols | 1 grams |
| Default serving size ⓘ Serving sizes are mostly taken from FDA's Reference Amounts Customarily Consumed (RACCs) | 1 slice cooked (8.1 grams) |
| Acidity (Based on PRAL) ⓘ PRAL (Potential renal acid load) is calculated using a formula. On the PRAL scale the higher the positive value, the more is the acidifying effect on the body. The lower the negative value, the higher the alkalinity of the food. 0 is neutral. | 24 (acidic) |
| Oxalates ⓘ https://www.hsph.harvard.edu/nutrition-questionnaire-service-center/nutrient-tables-download-page/ | 3 mg |
Protein ⓘHigher in Protein content than 99% of foods
Sodium ⓘHigher in Sodium content than 98% of foods
Fats ⓘHigher in Fats content than 96% of foods
Calories ⓘHigher in Calories content than 96% of foods
Saturated fat ⓘHigher in Saturated fat content than 92% of foods
Pork bacon calories (kcal)
| Calories for different serving sizes of pork bacon | Calories | Weight |
|---|---|---|
| Calories in 100 grams | 548 | |
| Calories in 1 slice cooked | 44 | 8.1 g |
| Calories for different varieties of pork bacon | Calories | Weight |
|---|---|---|
| Pork, cured, bacon, cooked, baked (this food) | 548 | 100 g |
| Pork, cured, ham -- water added, rump, bone-in, separable lean only, unheated | 95 | 100 g |
| Pork, cured, ham -- water added, rump, bone-in, separable lean only, heated, roasted | 121 | 100 g |
| Pork, cured, feet, pickled | 140 | 100 g |
| Pork, cured, ham -- water added, rump, bone-in, separable lean and fat, heated, roasted | 161 | 100 g |
| Pork, cured, ham -- water added, rump, bone-in, separable lean and fat, unheated | 172 | 100 g |
| Pork, cured, breakfast strips, raw or unheated | 388 | 100 g |
| Pork bacon | 417 | 100 g |
| Pork, cured, bacon, pre-sliced, cooked, pan-fried | 468 | 100 g |
| Pork, cured, bacon, cooked, microwaved | 476 | 100 g |
| Pork, cured, bacon, cooked, broiled, pan-fried or roasted, reduced sodium | 541 | 100 g |
Pork bacon Glycemic index (GI)
Source:
Check out our Glycemic index chart page for the full list.
Mineral coverage chart
Mineral chart - relative view
Vitamin coverage chart
Vitamin A:
33µg of 900µg
3.7%
Vitamin E:
0.96mg of 15mg
6.4%
Vitamin D:
0µg of 20µg
0%
Vitamin C:
0mg of 90mg
0%
Vitamin B1:
1mg of 1mg
87%
Vitamin B2:
0.75mg of 1mg
58%
Vitamin B3:
32mg of 16mg
199%
Vitamin B5:
3.1mg of 5mg
62%
Vitamin B6:
0.93mg of 1mg
71%
Folate:
6µg of 400µg
1.5%
Vitamin B12:
3.5µg of 2µg
145%
Choline:
358mg of 550mg
65%
Vitamin K:
0.3µg of 120µg
0.25%
Vitamin chart - relative view
Macronutrients chart
Protein:
Daily Value: 71%
35.7 g of 50 g
35.7 g (71% of DV )
Fats:
Daily Value: 67%
43.3 g of 65 g
43.3 g (67% of DV )
Carbs:
Daily Value: 0%
1.4 g of 300 g
1.4 g (0% of DV )
Water:
Daily Value: 1%
12.5 g of 2,000 g
12.5 g (1% of DV )
Other:
7.1 g
7.1 g
Protein quality breakdown
Tryptophan:
897mg of 280mg
320%
Threonine:
4197mg of 1,050mg
400%
Isoleucine:
5028mg of 1,400mg
359%
Leucine:
8346mg of 2,730mg
306%
Lysine:
8892mg of 2,100mg
423%
Methionine:
2385mg of 1,050mg
227%
Phenylalanine:
4251mg of 1,750mg
243%
Valine:
5703mg of 1,820mg
313%
Histidine:
4029mg of 700mg
576%
Fat type information
Saturated fat:
14 g
Monounsaturated fat:
19 g
Polyunsaturated fat:
4.9 g
All nutrients for Pork bacon per selected serving size (100 g)
| Nutrient | Value | DV% | In TOP % of foods | Comparison |
| Vitamin A | 11µg | 1% | 50% | |
| Calories | 548kcal | 27% | 4% |
11.7 times more than Orange
|
| Protein | 36g | 85% | 1% |
12.7 times more than Broccoli
|
| Fats | 43g | 67% | 4% |
1.3 times more than Cheese
|
| Vitamin C | 0mg | 0% | 100% |
N/A
|
| Net carbs | 1.4g | N/A | 68% |
40.1 times less than Chocolate
|
| Carbs | 1.4g | 0% | 69% |
20.9 times less than Rice
|
| Cholesterol | 107mg | 36% | 10% |
3.5 times less than Egg
|
| Magnesium | 30mg | 7% | 33% |
4.7 times less than Almonds
|
| Calcium | 10mg | 1% | 76% |
12.5 times less than Milk
|
| Potassium | 539mg | 16% | 12% |
3.7 times more than Cucumber
|
| Iron | 1.5mg | 19% | 48% |
1.7 times less than Beef broiled
|
| Sugar | 0g | N/A | 100% |
N/A
|
| Fiber | 0g | 0% | 100% |
N/A
|
| Copper | 0.18mg | 20% | 33% |
1.3 times more than Shiitake
|
| Zinc | 3.4mg | 31% | 28% |
1.9 times less than Beef broiled
|
| Phosphorus | 506mg | 72% | 9% |
2.8 times more than Chicken meat
|
| Sodium | 2193mg | 95% | 2% |
4.5 times more than White bread
|
| Vitamin E | 0.32mg | 2% | 65% |
4.6 times less than Kiwi
|
| Selenium | 59µg | 107% | 21% | |
| Manganese | 0.02mg | 1% | 75% | |
| Vitamin B1 | 0.35mg | 29% | 24% |
1.3 times more than Pea raw
|
| Vitamin B2 | 0.25mg | 19% | 33% |
1.9 times more than Avocado
|
| Vitamin B3 | 11mg | 66% | 11% |
1.1 times more than Turkey meat
|
| Vitamin B5 | 1mg | 21% | 34% |
1.1 times less than Sunflower seeds
|
| Vitamin B6 | 0.31mg | 24% | 39% |
2.6 times more than Oats
|
| Vitamin B12 | 1.2µg | 48% | 40% |
1.7 times more than Pork
|
| Vitamin K | 0.1µg | 0% | 88% |
1016 times less than Broccoli
|
| Trans fat | 0g | N/A | 100% |
N/A
|
| Folate | 2µg | 1% | 90% |
30.5 times less than Brussels sprouts
|
| Choline | 119mg | 22% | 48% | |
| Saturated fat | 14g | 71% | 8% |
2.4 times more than Beef broiled
|
| Monounsaturated fat | 19g | N/A | 11% |
1.9 times more than Avocado
|
| Polyunsaturated fat | 4.9g | N/A | 18% |
9.7 times less than Walnut
|
| Tryptophan | 0.3mg | 0% | 50% |
Equal to Chicken meat
|
| Threonine | 1.4mg | 0% | 44% |
1.9 times more than Beef broiled
|
| Isoleucine | 1.7mg | 0% | 42% |
1.8 times more than Salmon raw
|
| Leucine | 2.8mg | 0% | 42% |
1.1 times more than Tuna Bluefin
|
| Lysine | 3mg | 0% | 42% |
6.6 times more than Tofu
|
| Methionine | 0.8mg | 0% | 45% |
8.3 times more than Quinoa
|
| Phenylalanine | 1.4mg | 0% | 42% |
2.1 times more than Egg
|
| Valine | 1.9mg | 0% | 42% |
1.1 times less than Soybean raw
|
| Histidine | 1.3mg | 0% | 42% |
1.8 times more than Turkey meat
|
| Caffeine | 0mg | 0% | 100% | |
| Omega-3 - EPA | 0g | N/A | 100% |
N/A
|
| Omega-3 - DHA | 0g | N/A | 100% |
N/A
|
| Omega-3 - ALA | 0.21g | N/A | 82% |
43.5 times less than Canola oil
|
| Omega-3 - DPA | 0g | N/A | 100% |
N/A
|
| Omega-6 - Gamma-linoleic acid | 0g | N/A | 100% | |
| Omega-6 - Eicosadienoic acid | 0.2g | N/A | 72% | |
| Omega-6 - Linoleic acid | 4.1g | N/A | 82% |
3 times less than Almonds
|
Check out similar food or compare with current
NUTRITION FACTS LABEL
Nutrition Facts
___servings per container
Serving Size ______________
Serving Size ______________
Amount Per 100g
Calories 548
% Daily Value*
67%
Total Fat
43g
64%
Saturated Fat 14g
0
Trans Fat
0g
36%
Cholesterol 107mg
95%
Sodium 2193mg
0.45%
Total Carbohydrate
1.4g
0
Dietary Fiber
0g
Total Sugars 0g
Includes ? g Added Sugars
Protein
36g
Vitamin D
0mcg
0
Calcium
10mg
1%
Iron
1.5mg
19%
Potassium
539mg
16%
*
The % Daily Value (DV) tells you how much a nutrient in a serving of food contributes to a daily diet. 2,000 calories a day is used for general nutrition advice.
Health checks
ⓘ
Dietary cholesterol is not associated with an increased risk of coronary heart disease in healthy individuals. However, dietary cholesterol is common in foods that are high in harmful saturated fats.
Source
Low in Cholesterol
ⓘ
Trans fat consumption increases the risk of cardiovascular disease and mortality by negatively affecting blood lipid levels.
Source
No Trans Fats
ⓘ
Saturated fat intake can raise total cholesterol and LDL (low-density lipoprotein) levels, leading to an increased risk of atherosclerosis. Dietary guidelines recommend limiting saturated fats to under 10% of calories a day.
Source
Low in Saturated Fats
ⓘ
While the consumption of moderate amounts of added sugars is not detrimental to health, an excessive intake can increase the risk of obesity, and therefore, diabetes.
Source
Low in Sugars
Pork bacon nutrition infographic
Infographic link
References
All the values for which the sources are not specified explicitly are taken from FDA’s Food Central. The exact link to the food presented on this page can be found below.