Strawberry nutrition: calories, carbs, GI, protein, fiber, fats
Top nutrition facts for Strawberry
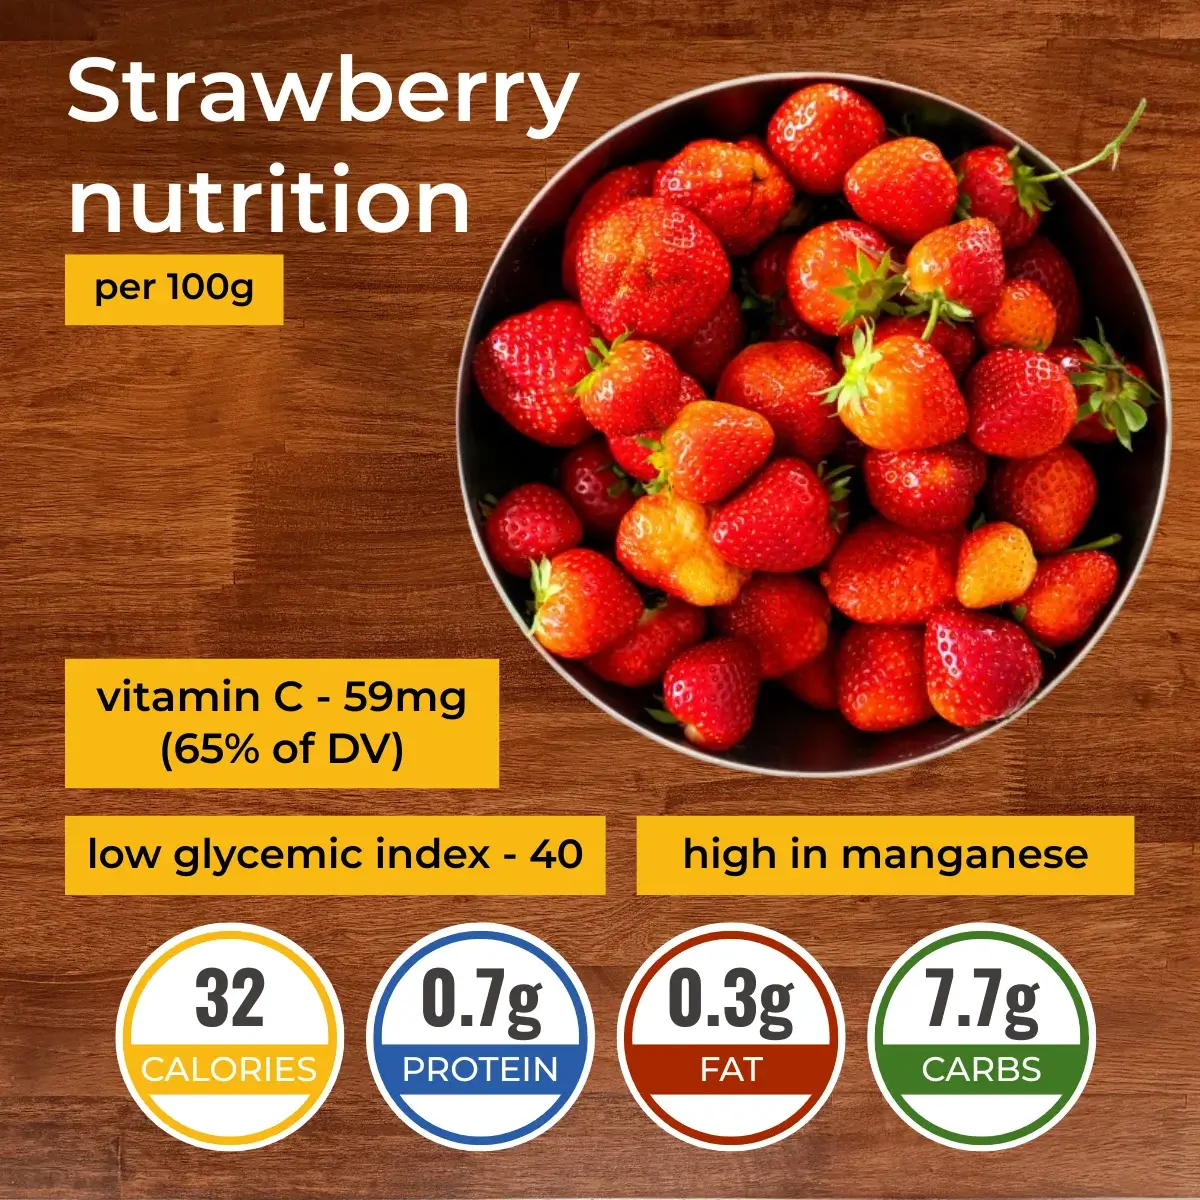
| Calories ⓘ Calories for selected serving | 32 kcal |
|
Glycemic index ⓘ
Source: Check out our full article on Strawberry glycemic index https://www.sciencedirect.com/science/article/pii/S0002916522004944Check out our Glycemic index chart page for the full list.
|
40 (low) |
| Glycemic load ⓘ Glycemic Load (GL) is a metric that measures both the quality (Glycemic Index) and quantity of carbohydrates in a specific serving of food to estimate its impact on blood sugar levels. It is calculated as: (GI × Carbs in grams) / 100. | 3 (low) |
| Net carbs ⓘ Net Carbs = Total Carbohydrates – Fiber – Sugar Alcohols | 6 g |
| Default serving size ⓘ Serving sizes are mostly taken from FDA's Reference Amounts Customarily Consumed (RACCs) | 1 NLEA serving (147 g) |
| Acidity (Based on PRAL) ⓘ PRAL (Potential renal acid load) is calculated using a formula. On the PRAL scale the higher the positive value, the more is the acidifying effect on the body. The lower the negative value, the higher the alkalinity of the food. 0 is neutral. | -2.5 (alkaline) |
| Oxalates | 31 mg ⓘ https://www.sciencedirect.com/science/article/abs/pii/S0889157513000902 |
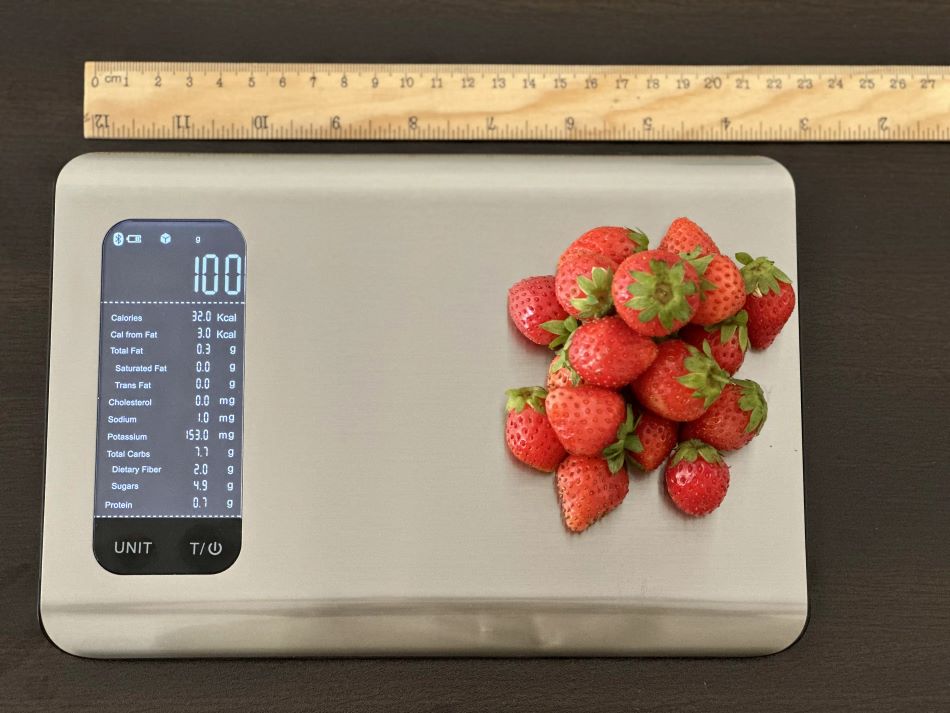
What Do 32 Calories or 100 Grams of Strawberry Look Like?
The picture above illustrates what 32 calories or 100 grams of strawberries look like, providing a visual reference to help you understand their weight and caloric content.
Based on our calculations, 100 grams or 32 calories are equivalent to approximately 19 strawberries. This breaks down to each strawberry weighing about 5.3 grams and containing around 2 calories. However, it's important to note that the calorie count may vary depending on factors such as size and ripeness. Unripe strawberries, for instance, tend to have lower sugar levels and consequently fewer calories than fully ripe ones.

Strawberry calories (kcal)
| Calories for different serving sizes of strawberry | Calories | Weight |
|---|---|---|
| Calories in 100 grams | 32 | |
| Calories in 1 cup, whole | 46 | 144 g |
| Calories in 1 NLEA serving | 47 | 147 g |
| Calories in 1 cup, halves | 49 | 152 g |
| Calories in 1 cup, sliced | 53 | 166 g |
| Calories in 1 cup, pureed | 74 | 232 g |
| Calories in 1 pint as purchased, yields | 114 | 357 g |
Extra Nutrition facts for Strawberry
| Protein per 100 calories ⓘ Shows how many grams of protein you get from 100 calories of this food, calculated as (protein in g ÷ calories) × 100. | 2.1 g |
| Calories per 10 g protein ⓘ Shows how many calories you need to eat from this food to get 10 g of protein, calculated as (calories ÷ protein in g) × 10. | 478 kcal |
| Weight per 100 calories ⓘ Shows how many grams of this food equal 100 kcal—higher grams mean a larger portion for the same calories. | 313 g |
Strawberry Glycemic index (GI)
Strawberry Glycemic load (GL)
Mineral coverage chart
Mineral chart - relative view
Vitamin coverage chart
Vitamin chart - relative view
Macronutrients chart
Protein quality breakdown
Fat type information
Carbohydrate type breakdown
Fiber content ratio for Strawberry
All nutrients for Strawberry per 100g
| Nutrient | Value | DV% | In TOP % of foods | Comparison |
| Vitamin A | 1µg | 0% | 55% | |
| Calories | 32kcal | 2% | 94% |
1.5 times less than Orange
|
| Protein per 100 calories | 2.1g | N/A | 71% | |
| Calories per 10 g protein | 478kcal | N/A | 26% | |
| Weight per 100 calories | 313g | N/A | 7% | |
| Protein | 0.67g | 2% | 89% |
4.2 times less than Broccoli
|
| Fats | 0.3g | 0% | 85% |
111 times less than Cheese
|
| Vitamin C | 59mg | 65% | 3% |
1.1 times more than Lemon
|
| Carbs | 7.7g | 3% | 54% |
3.7 times less than Rice
|
| Net carbs | 5.7g | N/A | 56% |
9.5 times less than Chocolate
|
| Cholesterol | 0mg | 0% | 100% |
N/A
|
| Vitamin D* | 0 IU | 0% | 100% |
N/A
|
| Vitamin D | 0µg | 0% | 100% |
N/A
|
| Magnesium | 13mg | 3% | 69% |
10.8 times less than Almonds
|
| Calcium | 16mg | 2% | 58% |
7.8 times less than Milk
|
| Potassium | 153mg | 5% | 66% |
Equal to Cucumber
|
| Iron | 0.41mg | 5% | 79% |
6.3 times less than Beef broiled
|
| Sugar | 4.9g | N/A | 28% |
1.8 times less than Coca-Cola
|
| Fiber | 2g | 8% | 31% |
1.2 times less than Orange
|
| Copper | 0.05mg | 5% | 67% |
3 times less than Shiitake
|
| Zinc | 0.14mg | 1% | 80% |
45.1 times less than Beef broiled
|
| Starch | 0.04g | 0% | 11% |
382.3 times less than Potato
|
| Phosphorus | 24mg | 3% | 81% |
7.6 times less than Chicken meat
|
| Sodium | 1mg | 0% | 97% |
490 times less than White bread
|
| Vitamin E | 0.29mg | 2% | 35% |
5 times less than Kiwi
|
| Manganese | 0.39mg | 17% | 17% | |
| Selenium | 0.4µg | 1% | 72% | |
| Vitamin B1 | 0.02mg | 2% | 78% |
11.1 times less than Pea raw
|
| Vitamin B2 | 0.02mg | 2% | 84% |
5.9 times less than Avocado
|
| Vitamin B3 | 0.39mg | 2% | 75% |
24.8 times less than Turkey meat
|
| Vitamin B5 | 0.13mg | 3% | 62% |
9 times less than Sunflower seeds
|
| Vitamin B6 | 0.05mg | 4% | 70% |
2.5 times less than Oats
|
| Vitamin B12 | 0µg | 0% | 100% |
N/A
|
| Vitamin K | 2.2µg | 2% | 24% |
46.2 times less than Broccoli
|
| Trans fat | 0g | N/A | 100% |
N/A
|
| Folate | 24µg | 6% | 31% |
2.5 times less than Brussels sprouts
|
| Choline | 5.7mg | 1% | 46% | |
| Saturated fat | 0.02g | 0% | 89% |
393 times less than Beef broiled
|
| Monounsaturated fat | 0.04g | N/A | 78% |
227.9 times less than Avocado
|
| Polyunsaturated fat | 0.16g | N/A | 74% |
304.3 times less than Walnut
|
| Tryptophan | 0.01mg | 0% | 55% |
38.1 times less than Chicken meat
|
| Threonine | 0.02mg | 0% | 56% |
36 times less than Beef broiled
|
| Isoleucine | 0.02mg | 0% | 56% |
57.1 times less than Salmon raw
|
| Leucine | 0.03mg | 0% | 56% |
71.5 times less than Tuna Bluefin
|
| Lysine | 0.03mg | 0% | 56% |
17.4 times less than Tofu
|
| Methionine | 0mg | 0% | 58% |
48 times less than Quinoa
|
| Phenylalanine | 0.02mg | 0% | 56% |
35.2 times less than Egg
|
| Valine | 0.02mg | 0% | 57% |
106.8 times less than Soybean raw
|
| Histidine | 0.01mg | 0% | 56% |
62.4 times less than Turkey meat
|
| Fructose | 2.4g | 3% | 3% |
2.4 times less than Apple
|
| Caffeine | 0mg | 0% | 100% | |
| Omega-3 - EPA | 0g | N/A | 100% |
N/A
|
| Omega-3 - DHA | 0g | N/A | 100% |
N/A
|
| Omega-3 - DPA | 0g | N/A | 100% |
N/A
|
Check out similar food or compare with current
NUTRITION FACTS LABEL
Serving Size ______________
Health checks
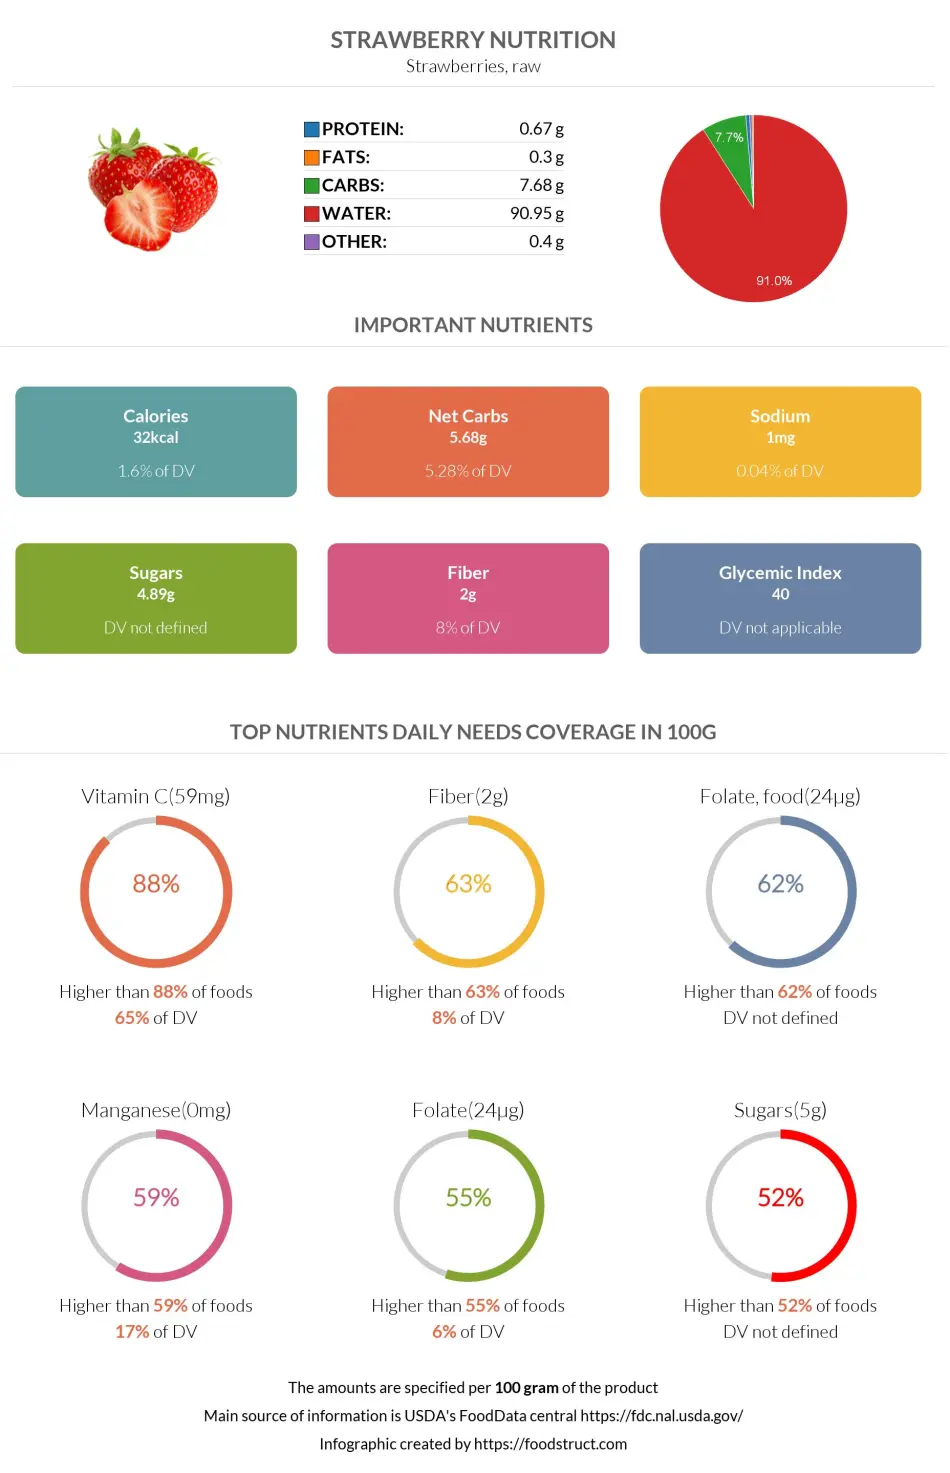
Strawberry nutrition infographic
References
All the values for which the sources are not specified explicitly are taken from FDA’s Food Central. The exact link to the food presented on this page can be found below.