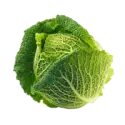
Savoy cabbage nutrition: calories, carbs, GI, protein, fiber, fats
Carbs in Savoy cabbage
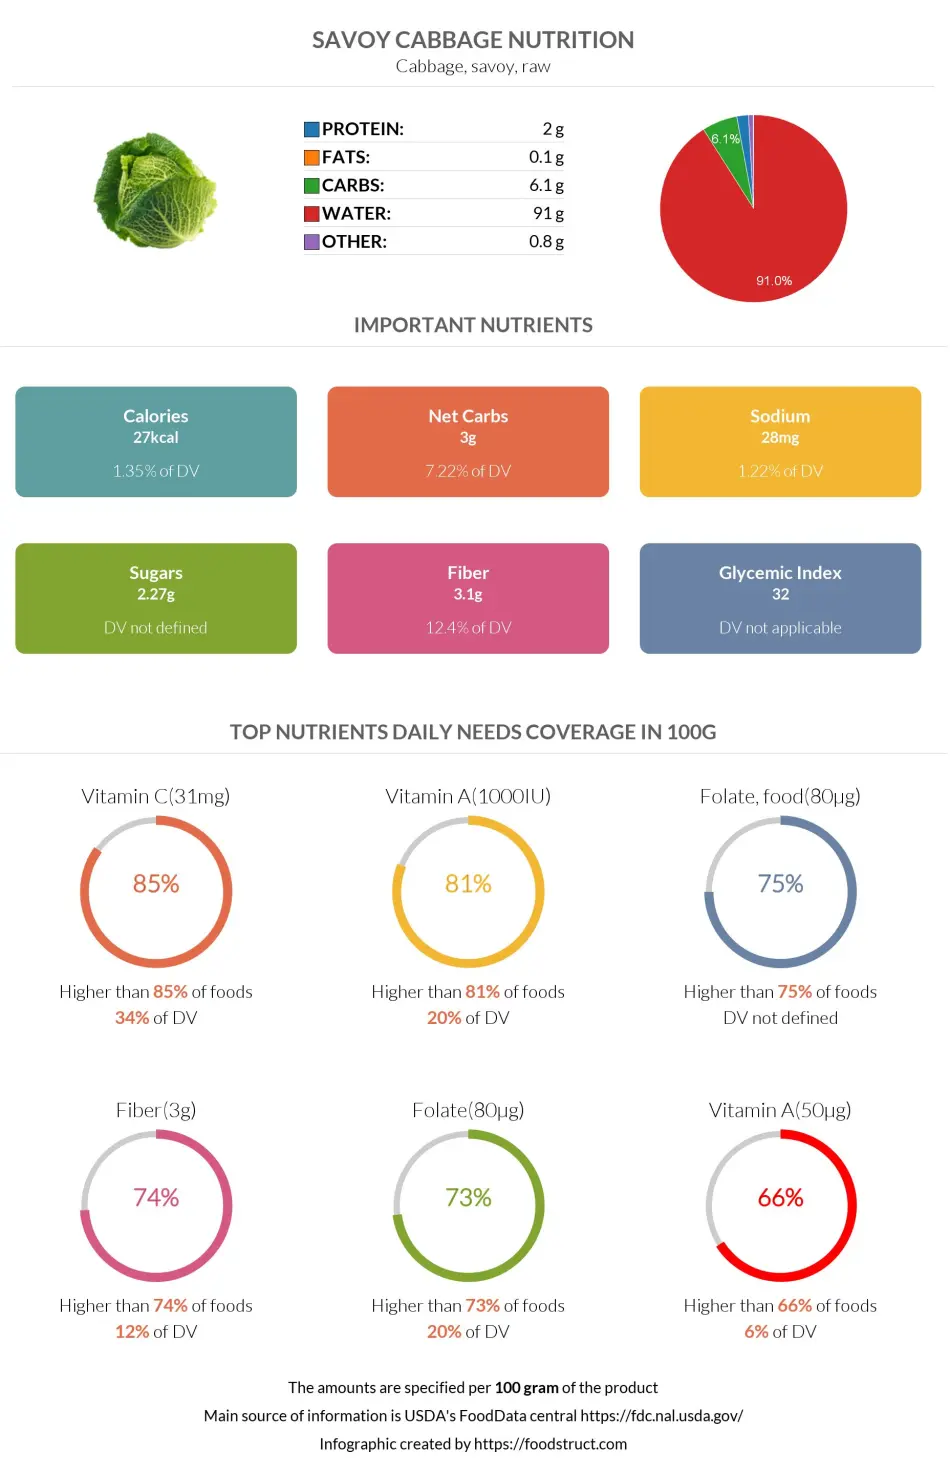
Savoy cabbage contains 6.1g of carbs per 100g, equal to 2% of daily carbohydrate needs. Savoy cabbage is 91% water.
Macronutrients chart
Carbs per serving size
Savoy cabbage is served in one cup (70g). This amount of vegetable contains 4.3g of carbs.
Carbohydrate type breakdown
In 100g of Savoy cabbage, there are 2.3g of sugars and 3.1g of fiber. The main sugars found in this vegetable are glucose and fructose (1).
Soluble or insoluble fiber
Savoy cabbage contains soluble and insoluble fiber (1).
The fiber in savoy cabbage helps to maintain bowel and cardiovascular health.
Fiber content ratio for Savoy cabbage
Savoy cabbage net carbs
Net carbs are calculated by subtracting fiber amounts from the carb content of the food. Savoy cabbage's net carb content equals 3g per 100g.
Calories in Savoy cabbage
Savoy cabbage is a low-calorie food because 100g contains only 27 calories.
Calories per serving size
Savoy cabbage is served in one cup (70g). This amount provides 18.9 calories.
Comparison
Savoy cabbage is lower in calories than 95% of foods.
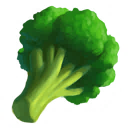
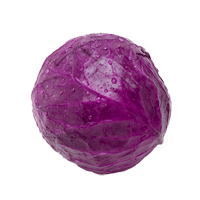
Savoy cabbage is lower in calories than Red cabbage and Broccoli.
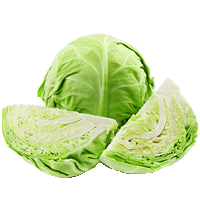
On the other hand, it is higher in calories than usual cabbage.
The table below shows the calorie content of Savoy cabbage and some other foods.
| Food | Calories |
| Broccoli | 34 |
| Red cabbage | 31 |
| Savoy cabbage | 27 |
| Cabbage | 25 |
| Cauliflower | 25 |
| Napa cabbage | 12 |
Burning estimates
The table below illustrates how long it takes to burn 18.9 calories (1 cup of Napa cabbage) and what type of activity is required. The period was evaluated using the MET approach (Metabolic Equivalent of a Task) (2) (3).
| 1 cup - 70kg person | 1 cup - 100kg person | |
| Walking | 5 min | 4 min |
| Running | 3 min | 2 min |
| Cycling | 2 min | 2 min |
REFERENCES
- https://www.sciencedirect.com/topics/agricultural-and-biological-sciences/savoy-cabbage
- https://www.ncbi.nlm.nih.gov/pmc/articles/PMC4428382/
- 2011 Compendium of Physical Activities

Important nutritional characteristics for Savoy cabbage
| Glycemic index ⓘ Gi values are taken from various scientific sources. GI values less than 55 are considered as low. Values above 70 are considered as high. | 32 (low) |
| Glycemic load | 1 (low) |
| Calories ⓘ Calories for selected serving | 27 kcal |
| Net Carbs ⓘ Net Carbs = Total Carbohydrates – Fiber – Sugar Alcohols | 3 grams |
| Default serving size ⓘ Serving sizes are mostly taken from FDA's Reference Amounts Customarily Consumed (RACCs) | 1 cup, shredded (70 grams) |
| Acidity (Based on PRAL) ⓘ PRAL (Potential renal acid load) is calculated using a formula. On the PRAL scale the higher the positive value, the more is the acidifying effect on the body. The lower the negative value, the higher the alkalinity of the food. 0 is neutral. | -3.5 (alkaline) |
| Oxalates ⓘ https://www.sciencedirect.com/science/article/abs/pii/S0308814602002121 | 4 mg |
Savoy cabbage calories (kcal)
| Serving Size | Calories | Weight |
|---|---|---|
| Calories in 100 grams | 27 | |
| Calories in 1 cup, shredded | 19 | 70 g |
Savoy cabbage Glycemic index (GI)
Savoy cabbage Glycemic load (GL)
Mineral coverage chart
Mineral chart - relative view
Vitamin coverage chart
Vitamin chart - relative view
Protein quality breakdown
Fat type information
All nutrients for Savoy cabbage per selected serving size (100 g)
| Nutrient | Value | DV% | In TOP % of foods | Comparison |
| Calories | 27kcal | 1% | 95% |
1.7 times less than Orange
|
| Protein | 2g | 5% | 78% |
1.4 times less than Broccoli
|
| Fats | 0.1g | 0% | 93% |
333.1 times less than Cheese
|
| Vitamin C | 31mg | 34% | 15% |
1.7 times less than Lemon
|
| Net carbs | 3g | N/A | 63% |
18.1 times less than Chocolate
|
| Carbs | 6.1g | 2% | 57% |
4.6 times less than Rice
|
| Cholesterol | 0mg | 0% | 100% |
N/A
|
| Vitamin D | 0µg | 0% | 100% |
N/A
|
| Magnesium | 28mg | 7% | 35% |
5 times less than Almond
|
| Calcium | 35mg | 4% | 41% |
3.6 times less than Milk
|
| Potassium | 230mg | 7% | 52% |
1.6 times more than Cucumber
|
| Iron | 0.4mg | 5% | 80% |
6.5 times less than Beef broiled
|
| Sugar | 2.3g | N/A | 58% |
4 times less than Coca-Cola
|
| Fiber | 3.1g | 12% | 26% |
1.3 times more than Orange
|
| Copper | 0.06mg | 7% | 74% |
2.3 times less than Shiitake
|
| Zinc | 0.27mg | 2% | 81% |
23.4 times less than Beef broiled
|
| Phosphorus | 42mg | 6% | 80% |
4.3 times less than Chicken meat
|
| Sodium | 28mg | 1% | 79% |
17.5 times less than White Bread
|
| Vitamin A | 1000IU | 20% | 19% |
16.7 times less than Carrot
|
| Vitamin A RAE | 50µg | 6% | 34% | |
| Vitamin E | 0.17mg | 1% | 79% |
8.6 times less than Kiwifruit
|
| Manganese | 0.18mg | 8% | 53% | |
| Selenium | 0.9µg | 2% | 83% | |
| Vitamin B1 | 0.07mg | 6% | 62% |
3.8 times less than Pea raw
|
| Vitamin B2 | 0.03mg | 2% | 87% |
4.3 times less than Avocado
|
| Vitamin B3 | 0.3mg | 2% | 84% |
31.9 times less than Turkey meat
|
| Vitamin B5 | 0.19mg | 4% | 82% |
6 times less than Sunflower seed
|
| Vitamin B6 | 0.19mg | 15% | 50% |
1.6 times more than Oat
|
| Vitamin B12 | 0µg | 0% | 100% |
N/A
|
| Vitamin K | 69µg | 57% | 43% |
1.5 times less than Broccoli
|
| Trans Fat | 0g | N/A | 100% |
N/A
|
| Folate | 80µg | 20% | 27% |
1.3 times more than Brussels sprout
|
| Saturated Fat | 0.01g | 0% | 93% |
453.5 times less than Beef broiled
|
| Choline | 12mg | 2% | 83% | |
| Monounsaturated Fat | 0.01g | N/A | 93% |
1399.9 times less than Avocado
|
| Polyunsaturated fat | 0.05g | N/A | 90% |
962.7 times less than Walnut
|
| Tryptophan | 0.02mg | 0% | 92% |
15.3 times less than Chicken meat
|
| Threonine | 0.07mg | 0% | 92% |
10.4 times less than Beef broiled
|
| Isoleucine | 0.1mg | 0% | 90% |
9 times less than Salmon raw
|
| Leucine | 0.1mg | 0% | 93% |
23.6 times less than Tuna Bluefin
|
| Lysine | 0.09mg | 0% | 91% |
4.8 times less than Tofu
|
| Methionine | 0.02mg | 0% | 93% |
4.8 times less than Quinoa
|
| Phenylalanine | 0.06mg | 0% | 93% |
10.4 times less than Egg
|
| Valine | 0.09mg | 0% | 92% |
23.9 times less than Soybean raw
|
| Histidine | 0.04mg | 0% | 92% |
18.3 times less than Turkey meat
|
| Omega-3 - EPA | 0g | N/A | 100% |
N/A
|
| Omega-3 - DHA | 0g | N/A | 100% |
N/A
|
| Omega-3 - DPA | 0g | N/A | 100% |
N/A
|
Check out similar food or compare with current
NUTRITION FACTS LABEL
Serving Size ______________
Health checks
Savoy cabbage nutrition infographic
References
All the values for which the sources are not specified explicitly are taken from FDA’s Food Central. The exact link to the food presented on this page can be found below.