Halibut vs. Turbot — Health Impact and Nutrition Comparison


Summary
Halibut is larger in size and usually more accessible due to its lower price. It is generally denser in nutrients and higher in calories.
Halibut is higher in fats, being particularly rich in monounsaturated fats, but lower in cholesterol. Trout, on the other hand, is richer in protein.
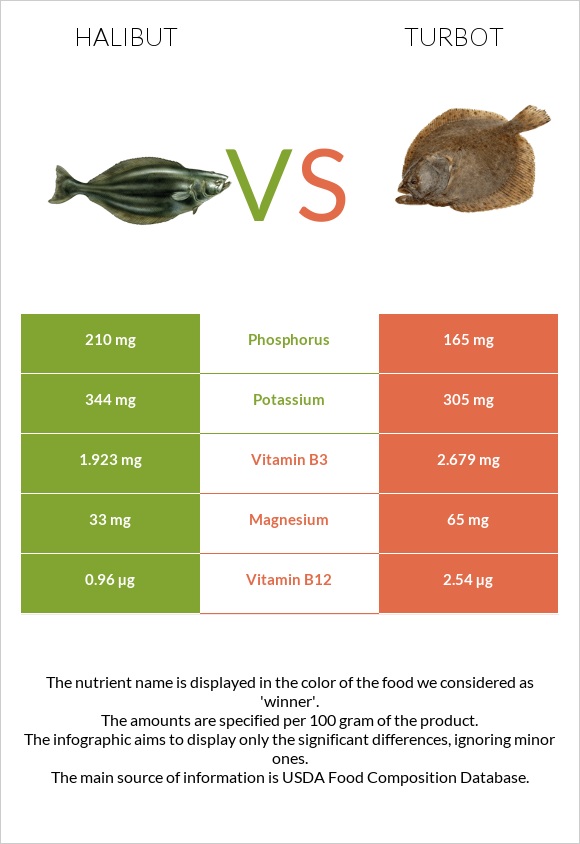
Turbot provides about 9 times more folate or vitamin B9, 3 times more vitamin B12, and 2 times more vitamin B5. However, halibut tends to be richer in fat-soluble vitamins A, D, E, and K, and is twice as high in vitamin B6.
Trout has 6 times more calcium and 2 times more magnesium, while halibut provides 2 times more iron and zinc.
Introduction
While halibut and turbot are two types of white flatfish, some qualities set them apart. In this article, we will focus on these qualities and discuss their impact on health, as supported by scientific evidence.
Taste and Use
Halibut is a larger fish with a mild flavor and a firm texture. Trout is smaller, tends to have a more delicate but rich taste, and a softer texture.
Halibut is more accessible and lower in price, while turbot tends to be considered a more refined and expensive option.
Nutrition
The nutritional infographics are presented for 100g servings of Greenland halibut and European turbot, both cooked by dry heat.
On our website, you can also find information about the nutritional values of these fish when cooked by other methods and in various serving sizes, if you're interested.
Macronutrients and Calories
Halibut is generally denser in nutrients, consisting of 62% nutrients and 38% water, while turbot is made up of 70% nutrients and 30% water.
Macronutrient Comparison
Contains
more
FatsFats
+369.3%
Contains
more
ProteinProtein
+11.7%
Contains
more
WaterWater
+13.8%
Contains
more
OtherOther
+164.8%
Calories
Halibut is significantly higher in calories due to a higher fat content. A 100g serving of halibut and turbot contains 239 and 122 calories, respectively. This means that halibut provides 117 more calories per 100g serving.
Protein
While both fish are good sources of protein, turbot is richer in this nutrient, containing 20.6g of protein per 100g serving, whereas the same amount of halibut provides 18.4g.
Turbot is naturally richer in all essential amino acids.
Fats
Halibut is a fattier fish, containing 14g more fat per 100g serving compared to turbot. A 100g serving of halibut provides 17.7g of fats, while the same serving of turbot has 3.8g of fats.
The fat found in halibut is composed of 69% monounsaturated fats, 20% saturated fats, and 11% polyunsaturated fatty acids. Half of the saturated acid in halibut is palmitic acid. Of the monounsaturated fats, there are mostly omega-7 and omega-9 fatty acids, such as palmitoleic acid, oleic acid, and erucic acid.
Exact information about the fatty acid composition of turbot is scarce.
Halibut is surprisingly slightly lower in cholesterol compared to turbot.
Carbohydrates
Like most fish, halibut and turbot contain no carbohydrates.
Vitamins
Turbot provides about 9 times more folate or vitamin B9, 3 times more vitamin B12, and 2 times more vitamin B5. It is also richer in vitamin B3 and contains vitamin C, which halibut lacks.
On the other hand, halibut is twice as rich in vitamin B6 and tends to provide more fat-soluble vitamins A, D, E, and K.
Vitamin Comparison
Contains
more
Vitamin AVitamin A
+50%
Contains
more
Vitamin B6Vitamin B6
+100.4%
Contains
more
Vitamin CVitamin C
+∞%
Contains
more
Vitamin B3Vitamin B3
+39.3%
Contains
more
Vitamin B5Vitamin B5
+128.5%
Contains
more
Vitamin B12Vitamin B12
+164.6%
Contains
more
FolateFolate
+800%
Minerals
The two types of fish have different mineral compositions. Halibut contains 2 times more iron and zinc and is somewhat higher in phosphorus and potassium.
In contrast, trout is 6 times richer in calcium, 2 times richer in magnesium, and overall richer in manganese and copper.
When comparing turbot and halibut cooked with the same method, unsalted halibut tends to contain less sodium than unsalted turbot.
Mineral Comparison
Contains
more
PotassiumPotassium
+12.8%
Contains
more
IronIron
+84.8%
Contains
more
ZincZinc
+82.1%
Contains
more
PhosphorusPhosphorus
+27.3%
Contains
less
SodiumSodium
-46.4%
Contains
more
MagnesiumMagnesium
+97%
Contains
more
CalciumCalcium
+475%
Contains
more
CopperCopper
+23.7%
Contains
more
ManganeseManganese
+46.7%
Glycemic Index
The glycemic index value of fish, such as halibut and turbot, is considered to be 0 as they contain no carbohydrates.
Insulin Index
The insulin index is a helpful tool for foods with no carbohydrates, as it provides insight into the effects of the given food on insulin levels. The insulin index value of white fish, such as turbot and halibut, is 59 (1).
Health Impact
Research on the effects of fish on health primarily focuses on either fatty fish or lean white fish. Halibut and trout are both lean white fish; however, their difference lies in their fat content - halibut is considerably higher in fats.
Cardiovascular Health
Research consistently shows that fish consumption is associated with a lower risk of cardiovascular disease. However, these findings are more consistent with the intake of fatty fish. The American Heart Association recommends eating fish twice a week (2, 3).
While fish intake can reduce the risk of cardiovascular disease, fried fish may have the opposite effect, being associated with an increased risk of cardiovascular events (4).
Diabetes
While some studies have found an inverse association between fish consumption and the risk of developing type 2 diabetes, high-quality meta-analyses have found no connection between the two (5, 6, 7).
Mercury Content
According to our findings, halibut and turbot contain approximately the same level of mercury (8, 9).
For pregnant or breastfeeding women, the FDA recommends eating only one serving of halibut a week due to its mercury content (10).
Sources.
- https://www.sciencedirect.com/science/article/pii/S2405457724001633
- https://pmc.ncbi.nlm.nih.gov/articles/PMC3705336/
- https://www.mdpi.com/2072-6643/15/21/4539
- https://pubmed.ncbi.nlm.nih.gov/33444594/
- https://journals.plos.org/plosone/article?id=10.1371/journal.pone.0089845
- https://www.mdpi.com/2072-6643/13/4/1223
- https://pmc.ncbi.nlm.nih.gov/articles/PMC2768220/
- https://pmc.ncbi.nlm.nih.gov/articles/PMC7923435
- https://www.fda.gov/food/environmental-contaminants-food/mercury-levels-commercial-fish-and-shellfish-1990-2012
- https://www.fda.gov/food/consumers/advice-about-eating-fish#choice

Infographic
All nutrients comparison - raw data values
| Nutrient | |
|
DV% diff. |
| Vitamin B12 | 0.96µg | 2.54µg | 66% |
| Monounsaturated fat | 10.742g | 27% | |
| Fats | 17.74g | 3.78g | 21% |
| Vitamin B6 | 0.485mg | 0.242mg | 19% |
| Saturated fat | 3.102g | 14% | |
| Polyunsaturated fat | 1.753g | 12% | |
| Magnesium | 33mg | 65mg | 8% |
| Vitamin B5 | 0.288mg | 0.658mg | 7% |
| Calories | 239kcal | 122kcal | 6% |
| Phosphorus | 210mg | 165mg | 6% |
| Iron | 0.85mg | 0.46mg | 5% |
| Vitamin B3 | 1.923mg | 2.679mg | 5% |
| Protein | 18.42g | 20.58g | 4% |
| Sodium | 103mg | 192mg | 4% |
| Vitamin C | 0mg | 1.7mg | 2% |
| Calcium | 4mg | 23mg | 2% |
| Zinc | 0.51mg | 0.28mg | 2% |
| Folate | 1µg | 9µg | 2% |
| Cholesterol | 59mg | 62mg | 1% |
| Potassium | 344mg | 305mg | 1% |
| Copper | 0.038mg | 0.047mg | 1% |
| Vitamin A | 18µg | 12µg | 1% |
| Protein per 100 calories | 7.7g | 17g | N/A |
| Calories per 10 g protein | 130kcal | 59kcal | N/A |
| Weight per 100 calories | 42g | 82g | N/A |
| Unsaturated / Saturated Fat ratio | 4 | N/A | |
| Manganese | 0.015mg | 0.022mg | 0% |
| Selenium | 46.8µg | 46.8µg | 0% |
| Vitamin B1 | 0.073mg | 0.076mg | 0% |
| Vitamin B2 | 0.103mg | 0.097mg | 0% |
| Tryptophan | 0.206mg | 0.23mg | 0% |
| Threonine | 0.808mg | 0.902mg | 0% |
| Isoleucine | 0.849mg | 0.948mg | 0% |
| Leucine | 1.497mg | 1.672mg | 0% |
| Lysine | 1.692mg | 1.89mg | 0% |
| Methionine | 0.545mg | 0.609mg | 0% |
| Phenylalanine | 0.719mg | 0.803mg | 0% |
| Valine | 0.949mg | 1.06mg | 0% |
| Histidine | 0.542mg | 0.606mg | 0% |
| Omega-3 - EPA | 0.674g | N/A | |
| Omega-3 - DHA | 0.504g | N/A | |
| Omega-3 - DPA | 0.114g | N/A |
People also compare


References
All the values for which the sources are not specified explicitly are taken from FDA’s Food Central. The exact link to the food presented on this page can be found below.
- Halibut - https://fdc.nal.usda.gov/fdc-app.html#/food-details/174232/nutrients
- Turbot - https://fdc.nal.usda.gov/fdc-app.html#/food-details/174245/nutrients
All the Daily Values are presented for males aged 31-50, for 2000-calorie diets.