Tilapia vs. Pollock — Health Impact and Nutrition Comparison


Summary
Tilapia and pollock are great additions to your diet if you're considering healthy protein sources. Tilapia is richer in copper, iron, and selenium. In comparison, pollock is richer in magnesium, phosphorus, calcium, zinc, and potassium. Tilapia is richer in vitamins D, E, B1, and B5. Pollock is richer in choline, vitamins B2, B3, B6, and B12.
Overall, when it comes to health impacts, pollock is a better option to consume.
Introduction
Fish have been a staple of human diets for centuries, providing a dense source of protein and vital nutrients. Of the countless species eaten globally, tilapia and pollock are notable for their popularity. Tilapia, a freshwater fish, and pollock, a cold oceanic fish, vary not just in environment but also in flavor, culinary uses, and nutritional content. This article delves into these distinctions and the differences in nutrition and health impacts, providing a comprehensive comparison between tilapia and pollock.
Types, Taste, and Usage
Tilapia
Tilapia is a group of cichlid fish native to freshwater bodies in Africa but now farmed globally. They are known for their mild, slightly sweet flavor and firm, white flesh. This neutral taste makes tilapia a versatile ingredient in various culinary traditions. It's commonly baked, grilled, fried, or incorporated into stews and curries. The fish's adaptability to different flavor profiles and cooking methods has contributed to its popularity in home kitchens and restaurants.
Pollock
Pollock includes species from the North Pacific and North Atlantic oceans, with the Alaska pollock being especially well-known. Pollock provides a white, flaky texture and mild flavor, slightly stronger than tilapia’s. It's a mainstay in processed seafood products such as fish sticks, imitation crab meat (surimi), and fast-food fish sandwiches. Aside from processed products, pollock is also consumed baked, poached, or sautéed, frequently paired with light seasonings to add to its natural flavor.
Nutritional Differences
Knowing the nutritional makeup of tilapia and pollock is vital to making proper dietary decisions. Here is a detailed comparison according to different nutritional parameters.
Calories
Tilapia and pollock are both low-calorie protein sources, which makes them great options for those who keep an eye on their caloric consumption.
Tilapia contains around 128 calories per 100 grams.
Pollock contains slightly fewer calories, offering around 111 calories per 100 grams.
Carbohydrates
These fish contain no carbohydrates by nature. Therefore, they are excellent for low-carb diets and people managing blood sugar.
Protein
Tilapia contains 26.2 grams of protein per 100 grams. On the other hand, pollocks offer around 23.5 grams of protein per 100 grams.
While both fish are excellent protein sources, tilapia has a slight edge in protein content.
Fats
The fat content and composition in fish contribute to their health benefits, particularly concerning heart health.
Tilapia contains about 2.65 grams of fat per 100 grams, with a higher proportion of omega-6 fatty acids.
Whereas pollock is lower in overall fat content, with some 1.19 grams of it per 100 grams, and has a greater proportion of omega-3 to omega-6 fatty acids.
Minerals
Tilapia and pollock have essential minerals present, but not in the same concentrations.
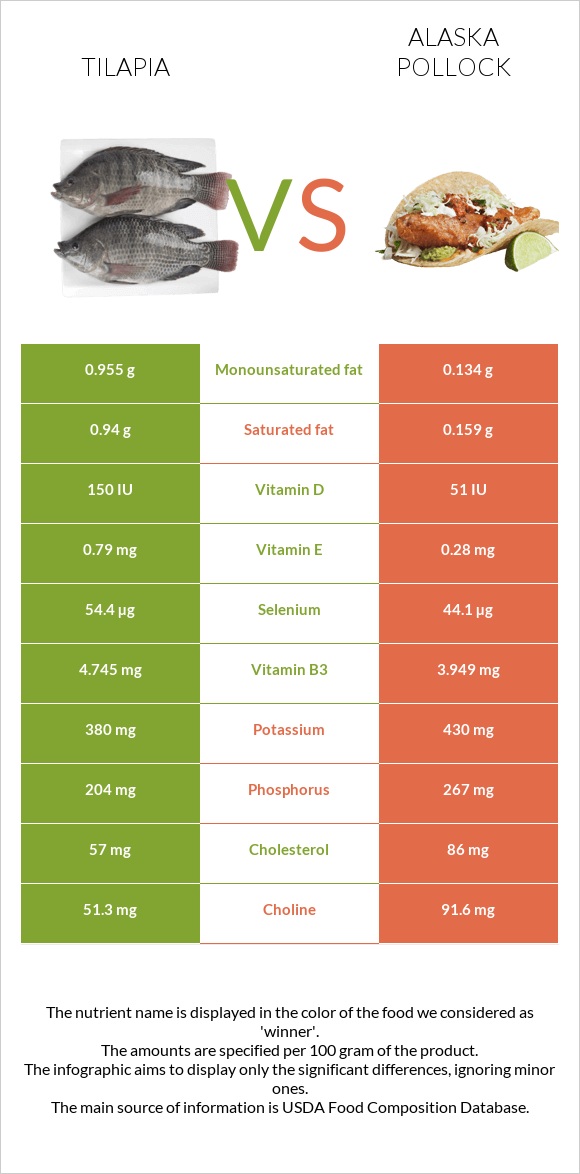
Tilapia is richer in copper, iron, and selenium. In comparison, pollock is richer in magnesium, phosphorus, calcium, zinc, and potassium. However, pollocks contain higher amounts of sodium.
Mineral Comparison
Contains
more
IronIron
+23.2%
Contains
more
CopperCopper
+25%
Contains
less
SodiumSodium
-86.6%
Contains
more
ManganeseManganese
+105.6%
Contains
more
SeleniumSelenium
+23.4%
Contains
more
MagnesiumMagnesium
+138.2%
Contains
more
CalciumCalcium
+414.3%
Contains
more
PotassiumPotassium
+13.2%
Contains
more
ZincZinc
+39%
Contains
more
PhosphorusPhosphorus
+30.9%
Vitamins
Tilapia is richer in vitamins D, E, B1, and B5. In comparison, pollocks are richer in choline, vitamins B2, B3, B6, and B12.
Vitamin Comparison
Contains
more
Vitamin DVitamin D
+184.6%
Contains
more
Vitamin EVitamin E
+182.1%
Contains
more
Vitamin B1Vitamin B1
+72.2%
Contains
more
Vitamin B3Vitamin B3
+20.2%
Contains
more
Vitamin B5Vitamin B5
+53.7%
Contains
more
Vitamin KVitamin K
+800%
Contains
more
FolateFolate
+100%
Contains
more
Vitamin AVitamin A
+∞%
Contains
more
Vitamin B2Vitamin B2
+205.5%
Contains
more
Vitamin B6Vitamin B6
+167.5%
Contains
more
Vitamin B12Vitamin B12
+96.8%
Health Impacts
Fish consumption, including popular varieties such as tilapia and pollock, is strongly linked to improved health biomarkers, particularly concerning diabetes management and cardiovascular health. Regular intake of these nutrient-rich fish has been shown to enhance blood sugar regulation, reduce inflammation, and support heart function by lowering blood pressure and cholesterol levels. Moreover, studies have consistently associated fish consumption with decreased mortality rates, highlighting its role in promoting overall longevity and reducing the risk of chronic diseases. (1)
Inflammation
When it comes to fish, we often consider their omega-3 content; however, we also need to focus on omega-6 content aswell. This is mainly due to the ratio of omega-6 to omega-3. It is important to consume more omega-3 than omega-6, and comparing these two types of fish, pollock is the better fish since it contains 15 times more omega-3 than tilapia. Tilapia has more omega-6 fish than omega-3, which is the topic of concern when choosing between these two types of fish. (2) (3)
Memory
Although this study was done on mice, the consumption of pollocks has a positive impact on memory and protective functions of the nervous system. (4)
Cardiovascular and Liver Health
Similarly to the one above, this study was done on mice. It is shown that consumption of pollock oil, in turn higher amounts of pollock fish, is linked with positive impacts on the cardiovascular system by regulating dyslipidemias. In addition, there was a decrease in hepatic steatosis in mice who were fed this oil. (5)
References

Infographic
All nutrients comparison - raw data values
| Nutrient | |
|
DV% diff. |
| Vitamin B12 | 1.86µg | 3.66µg | 75% |
| Selenium | 54.4µg | 44.1µg | 19% |
| Sodium | 56mg | 419mg | 16% |
| Vitamin B6 | 0.123mg | 0.329mg | 16% |
| Vitamin D* | 150 IU | 51 IU | 12% |
| Vitamin D | 3.7µg | 1.3µg | 12% |
| Vitamin B2 | 0.073mg | 0.223mg | 12% |
| Magnesium | 34mg | 81mg | 11% |
| Cholesterol | 57mg | 86mg | 10% |
| Phosphorus | 204mg | 267mg | 9% |
| Choline | 51.3mg | 91.6mg | 7% |
| Calcium | 14mg | 72mg | 6% |
| Protein | 26.15g | 23.48g | 5% |
| Vitamin B3 | 4.745mg | 3.949mg | 5% |
| Vitamin B5 | 0.664mg | 0.432mg | 5% |
| Saturated fat | 0.94g | 0.159g | 4% |
| Vitamin E | 0.79mg | 0.28mg | 3% |
| Vitamin B1 | 0.093mg | 0.054mg | 3% |
| Fats | 2.65g | 1.18g | 2% |
| Iron | 0.69mg | 0.56mg | 2% |
| Copper | 0.075mg | 0.06mg | 2% |
| Vitamin A | 0µg | 17µg | 2% |
| Monounsaturated fat | 0.955g | 0.134g | 2% |
| Calories | 128kcal | 111kcal | 1% |
| Potassium | 380mg | 430mg | 1% |
| Zinc | 0.41mg | 0.57mg | 1% |
| Manganese | 0.037mg | 0.018mg | 1% |
| Vitamin K | 0.9µg | 0.1µg | 1% |
| Folate | 6µg | 3µg | 1% |
| Protein per 100 calories | 20g | 21g | N/A |
| Calories per 10 g protein | 49kcal | 47kcal | N/A |
| Weight per 100 calories | 78g | 90g | N/A |
| Unsaturated / Saturated Fat ratio | 1.7 | 4.5 | N/A |
| Polyunsaturated fat | 0.6g | 0.583g | 0% |
| Tryptophan | 0.265mg | 0.263mg | 0% |
| Threonine | 1.156mg | 1.029mg | 0% |
| Isoleucine | 1.22mg | 1.082mg | 0% |
| Leucine | 2.04mg | 1.908mg | 0% |
| Lysine | 2.315mg | 2.157mg | 0% |
| Methionine | 0.766mg | 0.696mg | 0% |
| Phenylalanine | 1.05mg | 0.917mg | 0% |
| Valine | 1.28mg | 1.21mg | 0% |
| Histidine | 0.585mg | 0.691mg | 0% |
| Omega-3 - EPA | 0.005g | 0.086g | N/A |
| Omega-3 - DHA | 0.13g | 0.423g | N/A |
| Omega-3 - ALA | 0.045g | N/A | |
| Omega-3 - DPA | 0.06g | 0.027g | N/A |
| Omega-6 - Eicosadienoic acid | 0.015g | N/A |
Macronutrient Comparison
| Contains more ProteinProtein | +11.4% |
| Contains more FatsFats | +124.6% |
| Contains more OtherOther | +∞% |
Fat Type Comparison
| Contains more Mono. FatMonounsaturated fat | +612.7% |
| Contains less Sat. FatSaturated fat | -83.1% |
People also compare


References
All the values for which the sources are not specified explicitly are taken from FDA’s Food Central. The exact link to the food presented on this page can be found below.
- Tilapia - https://fdc.nal.usda.gov/fdc-app.html#/food-details/175177/nutrients
- Pollock - https://fdc.nal.usda.gov/fdc-app.html#/food-details/173681/nutrients
All the Daily Values are presented for males aged 31-50, for 2000-calorie diets.